Comments
- No comments found

Each year, the Credit Suisse Research Institute publishes a “Global Investment Returns Yearbook,” with a summary edition available online (February 2022).
This year’s version is authored by Elroy Dimson, Paul Marsh, and Mike Staunton, and includes a special topics chapter focused on “Diversification.” As the authors point out, “Diversification allows us to either reduce risk for the same level of expected return or increase expected returns for the same level of risk.” They discuss the evidence and arguments for diversifying across stocks, across countries, and across asset classes. Here are a few points that caught my eye from a much more in-depth discussion.
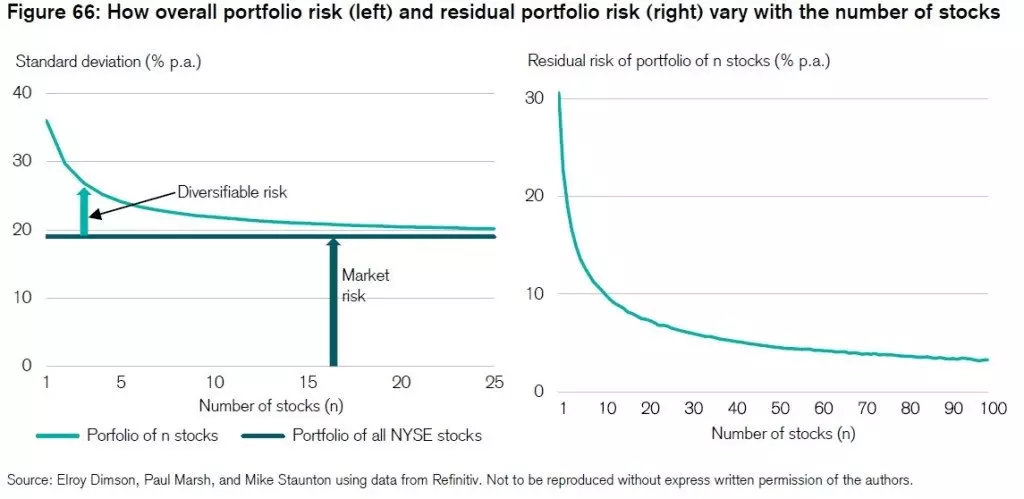
For diversifying across stocks, let’s start with a figure that, as the authors say appears in “[a]most every textbook in investments or corporate finance.” (All figures in this blog post are reproduced with explicit permission of the authors.) In the first panel, the dark blue line shows the market risk for all stocks traded on the New York Stock Exchange from 2011 to 2020: that is, the standard deviation of the return in a given year is plus or minus about 20%. The lighter blue line looks at the risk of portfolios that include one stock, two stocks, three stocks, and so on up to 25 stocks–with these portfolios chosen at random. Because diversification means that random winners and losers will tend to balance each other out, a portfolio with more stocks will tend to have less risk, gradually approaching the risk of the market portfolio.
The authors write:
Conventional wisdom is that a small number of stocks – say 10 to 20 – is sufficient to provide market-mimicking returns. That interpretation is misleading … Many more stocks are needed to create a well-diversified portfolio. It would be more helpful if the standard diversification chart was presented as on the right-hand side of Figure 66, which shows the fall in unsystematic risk as the number of stocks is increased. It shows that even with 100 stocks, the tracking error is still 3.3% per annum. …
Despite the longstanding and widespread advice to hold well-diversified portfolios, many studies find that most investors hold very concentrated portfolios. Goetzmann and Kumar (2008), for example, analyzed more than 60,000 investors at a large US discount brokerage house. Their average holding was four stocks (the median was three). Only 5% held fewer than ten stocks. The level of underdiversification was greater among younger, low-income, less educated and less sophisticated investors.
There are large costs to being underdiversified. Bessembinder (2018) shows that the majority of US stocks (57.4%) have had lifetime buy-and-hold returns below that on Treasury bills. Since 1926, the best-performing 4% of companies explain the net gain for the entire US stock market. This is caused by the strong positive skewness in individual stock returns. The positive premium over bills that we observe for overall stock markets is driven by very large returns for relatively few stocks. Bessembinder et al. (2021) examined some 64,000 stocks from 42 countries and showed that the same pattern held for non- US stocks. The average individual with a concentrated portfolio is thus likely to receive less than the return on the overall market.
Does the same lesson of diversification apply across countries? Perhaps not for US investors, at least not in the last half-century of so. Here’s a figure showing the share of different countries in global equity markets in 1899 and at the start of 2022. In 1899, the US accounted for 15% of all global equity markets; by the start of 2022, the US was about 60% of all global equity markets. Some of the major equity markets back at the start of the 20th century are much less important like the UK, Germany, and France. Other equity markets that seemed important at the end of 1899, like Russia and the Austro-Hungarian Empire, essentially disappeared and provided zero value for their investors.
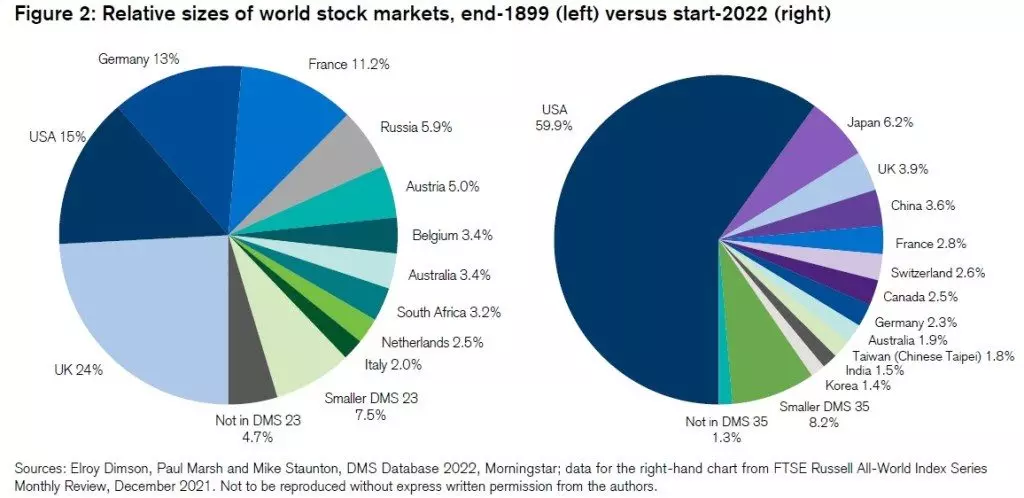
The dramatically different results for US equity markets imply that if you were outside the US economy and invested in US stocks, that was an excellent move to diversify. But if you were inside the US and thinking about investing outside the country, the potential results from diversifying to other countries are much smaller, or negative. Dimson, Marsh, and Staunton write:
From 1980 onward, US investors made increasingly large investments in overseas equities. However, in risk-return terms, they would have been better off staying at home. … Moreover, this is before taking account of the higher costs of investing internationally in the earlier part of this period.
For a US investor, domestic investment beats global investment over these … periods for two reasons. First, US equities performed exceptionally well. Over the 48 years from 1974 to 2021, US stocks beat non-US stocks by 1.9% per year. Over the 32 years since 1990, the outperformance was even greater at 4.6% per annum. Dimson, Marsh and Staunton (2021) have documented this continuing outperformance of US equities and describe it as a case of “American exceptionalism.”
Second, over this period, global diversification failed to lower volatility for US investors. The US equity market was among the world’s least volatile as its size, scope and breadth ensured that it was highly diversified. Over the 1974–2021 period, the equally weighted average SD [standard deviation] of non-US countries in the world index was almost double that of the US market. US investors had less to gain from risk reduction than their foreign counterparts.
In addition, a number of large US firms had much more involvement in global markets in recent decades: thus, by investing in the stock of those US firms, an investor was in effect, if indirectly, diversifying across countries to some extent. Conversely, deciding to buy stock in foreign markets directly involves various transaction costs as well as exposure to currency fluctuations, regulatory changes, and political risks.
Finally, what about diversifying across classes of assets: in particular, the authors focus on diversifying across the two major classes of assets, stocks and bonds. They point out that the correlation between returns on stocks and bonds has shifted substantially in the last 20 years or so. The darker blue line shows correlation between returns on stocks and bonds for the US; the lighter blue line for the UK. The key point here for most of the 20th century, returns on stocks and bonds were positively correlated, but starting around 2000 they have been negatively correlated, especially in the US.
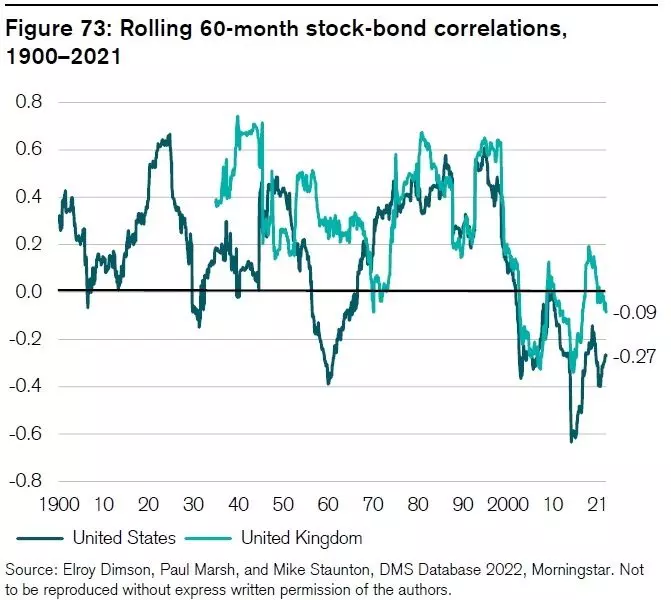
From a standpoint of diversification, a negative correlation between stocks and bonds is very helpful: gains in one will tend to offset losses in the other, and vice versa. But why has the pattern shifted? And will the change be lasting? The authors list some possible factors, but argue that this remains a puzzle. They write:
The stock-bond correlation plays an important role in institutional portfolio construction. It is central to forming optimal portfolios, designing hedging strategies and assessing risk. Stock-bond correlations have now been mostly negative in major world markets for some 20 years. This negative correlation means that stocks and bonds have served as a hedge for each other, enabling investors to increase stock allocations while still satisfying a portfolio risk budget. …
In recent years, much research has focused on why the sign of the stock-bond correlation flipped in the late 1990s. What was different about the period before and afterwards? From
the late 1990s on, there were more frequent crises, including three major bear markets, much lower/falling real and nominal interest rates, far lower and more stable inflation, somewhat slower economic growth, a more accommodative monetary policy (especially from 2008), somewhat more volatile and lower real equity returns, and less volatile and higher real bond returns.
The period since the late 1990s is relatively short, making it hard to establish statistically significant results. … Despite the volume of research, neither theory nor empirical studies point to a single or clear explanation for the negative stock-bond correlation. Those who claim to have found explanations largely replace one puzzle with another. For example, why have crises been more frequent or why has the correlation between the output gap and inflation changed signs?
Timothy Taylor is an American economist. He is managing editor of the Journal of Economic Perspectives, a quarterly academic journal produced at Macalester College and published by the American Economic Association. Taylor received his Bachelor of Arts degree from Haverford College and a master's degree in economics from Stanford University. At Stanford, he was winner of the award for excellent teaching in a large class (more than 30 students) given by the Associated Students of Stanford University. At Minnesota, he was named a Distinguished Lecturer by the Department of Economics and voted Teacher of the Year by the master's degree students at the Hubert H. Humphrey Institute of Public Affairs. Taylor has been a guest speaker for groups of teachers of high school economics, visiting diplomats from eastern Europe, talk-radio shows, and community groups. From 1989 to 1997, Professor Taylor wrote an economics opinion column for the San Jose Mercury-News. He has published multiple lectures on economics through The Teaching Company. With Rudolph Penner and Isabel Sawhill, he is co-author of Updating America's Social Contract (2000), whose first chapter provided an early radical centrist perspective, "An Agenda for the Radical Middle". Taylor is also the author of The Instant Economist: Everything You Need to Know About How the Economy Works, published by the Penguin Group in 2012. The fourth edition of Taylor's Principles of Economics textbook was published by Textbook Media in 2017.
BBN Times connects decision makers to you. Experts in their fields, worth listening to, are the ones who write our articles. We believe these are the real commentators of the future. We quickly and accurately deliver serious information around the world. BBN Times provides its readers human expertise to find trusted answers by providing a platform and a voice to anyone willing to know more about the latest trends. Stay tuned, the revolution has begun.
Leave your comments
Post comment as a guest