Comments
- No comments found

You’re an ambitious CEO of a business with real potential.
You’ve assembled a great team of A-Players and everything looks set for exponential growth. And yet, it’s not happening. Time and time again, you’re missing your profit targets. What’s going wrong?
Most likely, it’s down to labour productivity. More than access to capital, tax policy or research and development, it’s the productivity of your people that will power your profit. Getting the staffing balance right can be really tricky, particularly ensuring you have the right percentage of management-level labour. Most people measure this as a percentage of revenue or gross profit per head, but this can be too blunt. It doesn’t tell you if labour was productive or generated sufficient profit.
Instead, I’d like to introduce you to a tool, the ‘labour efficiency ratio’ that, once understood, can be transformational for your business.
We first heard about this neat equation when we invited Greg Crabtree, author of Simple Numbers, onto our Melting Pot podcast. Greg co-authored the cash chapter in Verne Harnish’s ‘Scaling Up’ and is famous for cutting through the jargon to make his theories accessible. One of these is the labour efficiency ratio (LER).
In essence, the LER measures the productivity of your people through time and can be used to optimise your economic engine for maximum profit. Think of it in the same way as you would a savings account. You put money into the bank because you want to make that money more productive and earn interest. In the same way, you put money into your workforce so that it will produce more profit. You want to know that for every pound you spend on labour, you’re going to leverage it and get something back.
Your LER will enable you to view this in terms of multipliers – for example, for every £1 you spend on labour, you get £3 back. As you look to the future and plan your revenue goals, this tool enables you to work out how many people you’ll need and what your gross margin will be. As you get bigger and grow your management overhead, it allows you to plan the right level of management, admin and sales versus the people who are delivering the work.
To be useful, Greg advises calculating two distinct LERs that can be monitored separately. The first is what he calls, ‘Direct Labour Efficiency’ (LER) which is calculated by dividing gross margin by direct labour costs (ie the frontline staff who are delivering the work) and the second is Management Labour Efficiency (mLER) which is contribution margin (gross margin minus direct cost of labour) divided by management costs (including admin and sales roles).
When you begin working with these ratios, you’ll gain a unique perspective on your business model. It’s always great to discuss these things in theory, but even better when we see them work in practice. Our client Etch had traditionally used utilisation and efficiency ratios to see if they were running their teams effectively. So we added in their LER. They could see that an LER that measured just under 2 generated a net profit of 10%. If it was just over 2, it generated a profit of 20% – a pretty significant difference
This gave Etch a really clear steer on which areas of labour needed adjustment to increase their profit. They could put in place a target LER for each client or project so that they’d know when the right time came to add more people to grow. Similarly, they now had a tool to work out if they were paying too much for labour or whether existing labour was unproductive. How useful is that?
Ultimately, if you have a business that’s generating less than 10% net profit, it’s probably not sustainable. Ideally, it needs to be up at the 15% mark. If it hits 20% or above, you’re probably making too much money. Either you’re underpaying people or you’re working them too hard. You might be able to sustain 20% for a while but it’s unlikely the market will let that happen long term.
LER can be measured on a weekly, monthly and quarterly basis and used to work out the profitability of specific projects or for a specific customer. This means the person running the project doesn’t get to the end of it before they realise that they’ve over-delivered or used too many resources. If you’ve got an hourly rate that your team’s costing you or you know how much work you’ve done, you can use LER to monitor progress. Then you can decide your goals for LER.
As well as this, LER provides a useful benchmark to evaluate what you’re charging clients and who you’re going to choose to deliver the project. In fact, you can set an LER target before the proposal goes out so that you know that every project is structured to generate the right level of profit.
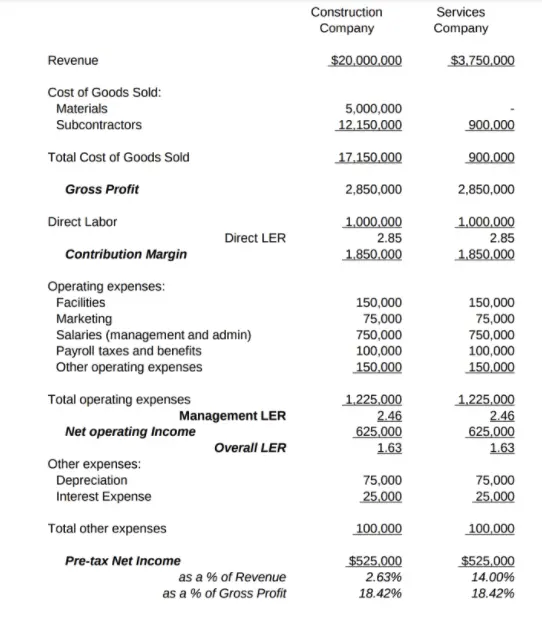
An example from Greg Crabtree simplenumbers.me
Let’s say you’re recruiting a new salesperson and you know their salary is likely to be £100K. So you’re adding this cost to your overall costs for management/admin/sales. You can now gross that salary up to the contribution margin, gross margin and revenue lines. This enables you to calculate the revenue or gross margin (prefered goal for salespeople) this new hire needs to generate to be neutral to the mLER. You will be aiming for at least a 50% return (private firms generate 50% to 100% return on capital invested) on your investment in their salary or it makes no sense to hire them. So take £150k and gross up to contribution level then to gross margin level and then revenue. Now you have the necessary sales goals at revenue and gross margin.
How do you set sales goals today? Do you have any idea of the return you’re expecting or generating from your investment? Obviously, it takes time for salespeople to ramp up and they should be delivering the required return between 12 and 24 months after starting.
Similarly, you should be able to work out the return you’re expecting on marketing. Often, we find clients that aren’t growing fast enough are underspending on marketing. Your mLER will give you a strong indication of whether this area needs adjustment.
You’ll also start to understand the implications of putting your prices up. If your costs stay the same, you’ll see a direct increase in your LER as your margin increases. And if your salary bill is increasing (as so many are at the moment), you can model this through the LER to see what you need to do to prices to maintain your margin. There really are so many uses for this metric!
Make sure when you’re calculating your mLER that you’re using a number that is the market rate for the role you do in the firm. Work out what it would cost to replace your role in the business. You may only be paying yourself £30K to £50K but it might cost more like £150K to recruit someone at the same level. Or you may be paying yourself £150k and you could replace yourself at £75k. Make sure you include this true figure when you do your numbers. Then you will see what your real profitability level is. It’s a much truer version of reality. Once you know where you are you can plan for the future.
Dominic Monkhouse is a proven architect of business growth with a demonstrable track record. As managing director, he scaled two UK technology companies from zero revenue to £30 million in five years. Since 2014, Dominic has worked as a CEO and executive team coach, helping ambitious CEOs and their leadership teams reach their full potential and achieve sustainable growth. He is the host of “The Melting Pot with Dominic Monkhouse” where he talks with some extraordinary thought leaders, fellow business authors, and CEOs to absorb their wisdom. Dominic is the author of F**K PLAN B: How to scale your technology business faster and achieve plan A, an exciting blueprint for cultural change and business transformation.
BBN Times connects decision makers to you. Experts in their fields, worth listening to, are the ones who write our articles. We believe these are the real commentators of the future. We quickly and accurately deliver serious information around the world. BBN Times provides its readers human expertise to find trusted answers by providing a platform and a voice to anyone willing to know more about the latest trends. Stay tuned, the revolution has begun.
Leave your comments
Post comment as a guest