Comments
- No comments found

There’s a standard story about the underlying causes of the Great Recession of 2007-9.
I’m sure I’ve told it myself a time or two.
It starts with excessively easy lending for home mortgages–including the so-called “sub-prime” loans–aided and abetted by financial engineering that repackaged these loans as “collateralized debt obligations” and sold them to investors, including banks. The surge of mortgage lending helped to stimulate home prices to unrealistically large annual increases. But reality eventually catches up. Home prices drop from their unrealistic highs, borrowers are unable to repay their mortgages, the financial sector seizes up, and recession is unleashed.
This story isn’t exactly wrong, but the path of housing prices since 2008 suggests that it isn’t completely right, either. Because remember those home prices that were “unrealistically” high in 2006 and then fell back to earth in 2007-8? Those housing prices have since rebounded back to where they were before the Great Recession.
The figure shows several indexes of housing prices. I will just say briefly (before the light of interest in the eyes of readers begins to fade) that there’s an interesting problem in how to measure home prices over time. If one just looks at prices of recent sales, for example, it’s likely that you will tend to overvalue newer, more expensive homes. Ideally, you want to look at the price of homes of equivalent quality, which is done by using a “repeat sales” method–that is, it looks at the price of a given home that is sold (or the mortgage is refinanced) more than once, so that you can then calculate the rise in the price of homes of unchanged quality over time. The housing price index then combines all the data from these repeat sales of individual homes. Both the “All Transactions” indexes below from the Federal Home Finance Agency and the Case-Schiller Index now published by S&P Corelogic use versions of the repeat sales approach, with some differences in sample size and aggregation method.
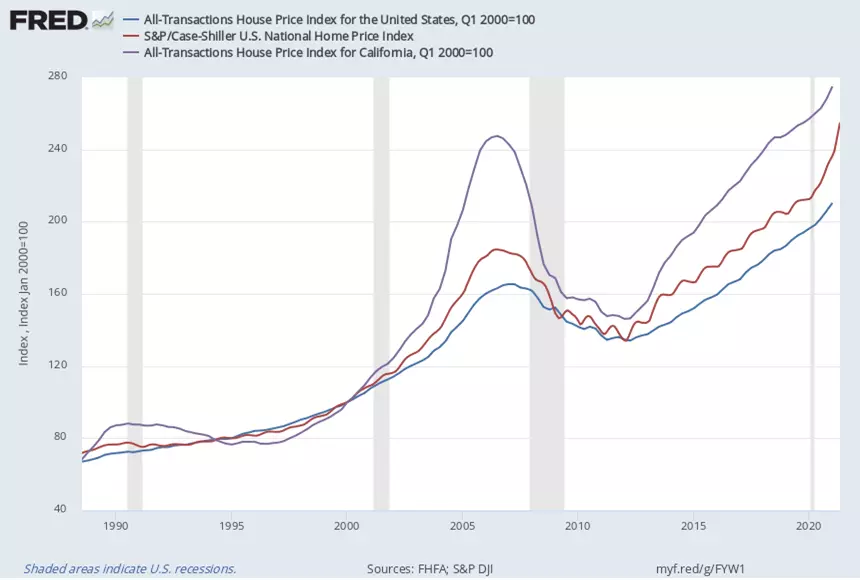
Using 20-20 hindsight, it looks as if there has been an overall rise in home prices since the mid-1990s, with a speed bump in the middle of the rise. The blue and red lines show data for the US economy as a whole; the purple line focuses on California, where the housing price rise was faster, the fall was larger, and the ensuing rise has been faster, too. It looks rather as if the higher prices of homes back circa 2006 were in fact not grossly unreasonable when viewed from the perspective of a decade or so later.
How does one make sense of this pattern? Gabriel Chodorow-Reich, Adam M. Guren, and Timothy J. McQuade offer an analysis in “The 2000s Housing Cycle with 2020 Hindsight: A Neo-Kindlebergian View (NBER Working Paper 29140, August 2021). “Kindlebergian” is a grotesque coinage referring to the work of Charles Kindleberger, whose 1978 historical overview of Manias, Panics, and Crashes: A History of Financial Crises is a touchstone for anyone trying to understand cycles of boom and bust. This research paper has the normal dose of mathematical and statistical tools, so I can’t recommend it for general readers. But the conclusion lays out the underlying logic of how a reasonable and understandable rise in house values, based on fundamental factors like local income, amenities, and supply factors, can for a time get ahead of itself. That is, prices rise faster for a time than makes sense based on the underlying fundamentals, but then after a correction, prices move to a new equilibrium. They write:
We revisit the 2000s housing cycle with “2020 hindsight.” At the city level, the areas with the largest price increases during the housing boom from 1997 to 2006 had the largest busts from 2006 to 2012 but also the fastest growth after the trough, and as a result have had the largest price appreciation over the full cycle. We present a standard spatial equilibrium framework of house price growth determined by local income, amenities, and supply determinants and show this framework fits the cross-section of city house price growth between 1997 and 2019. The implied long-run fundamental is correlated not only with long-run price growth but also with a strong boom-bust-rebound pattern.
Our neo-Kindlbergererian interpretation emphasizes the role of economic fundamentals in setting off this asset price cycle. In our model, the boom results from over-optimism about an increase in the “dividend” growth rate, the bust ensues when beliefs of home buyers and lenders correct, exacerbated by a price-foreclosure spiral that pushes prices below their full-information level, and eventually a rebound emerges as the economy converges to a price path commensurate with fundamental growth. We also acknowledge other features of the episode, including changes in credit supply and speculation, but conclude that these forces cannot substitute for the role of fundamentals as a driving force. … Our findings suggest that while policy may want to temper over-optimism and aggressively mitigate foreclosures, it is also important not to suffocate fundamentally-driven growth. Of course hindsight is 20-20; distinguishing fundamental growth from over-optimism in real time rather than after observing a full boom-bust-rebound poses a formidable task.
Of course, demonstrating that it is possible to construct a model reflecting the pattern of home prices in the last 25 years or so does not prove that the particular model used is the correct one. It seems to me that the rock-bottom interest rates since the Great Recession have also played a role in keeping housing prices high. But that said, those who averred that US housing prices were ridiculously and unsustainably high circa 2006 were apparently correct about the short-run, but not the medium-run.
Timothy Taylor is an American economist. He is managing editor of the Journal of Economic Perspectives, a quarterly academic journal produced at Macalester College and published by the American Economic Association. Taylor received his Bachelor of Arts degree from Haverford College and a master's degree in economics from Stanford University. At Stanford, he was winner of the award for excellent teaching in a large class (more than 30 students) given by the Associated Students of Stanford University. At Minnesota, he was named a Distinguished Lecturer by the Department of Economics and voted Teacher of the Year by the master's degree students at the Hubert H. Humphrey Institute of Public Affairs. Taylor has been a guest speaker for groups of teachers of high school economics, visiting diplomats from eastern Europe, talk-radio shows, and community groups. From 1989 to 1997, Professor Taylor wrote an economics opinion column for the San Jose Mercury-News. He has published multiple lectures on economics through The Teaching Company. With Rudolph Penner and Isabel Sawhill, he is co-author of Updating America's Social Contract (2000), whose first chapter provided an early radical centrist perspective, "An Agenda for the Radical Middle". Taylor is also the author of The Instant Economist: Everything You Need to Know About How the Economy Works, published by the Penguin Group in 2012. The fourth edition of Taylor's Principles of Economics textbook was published by Textbook Media in 2017.
BBN Times connects decision makers to you. Experts in their fields, worth listening to, are the ones who write our articles. We believe these are the real commentators of the future. We quickly and accurately deliver serious information around the world. BBN Times provides its readers human expertise to find trusted answers by providing a platform and a voice to anyone willing to know more about the latest trends. Stay tuned, the revolution has begun.
Leave your comments
Post comment as a guest