Given the official policy response to the Great Financial Recession – a mixture of central bank balance sheet expansion, lower for longer interest rates and a general lack of fiscal rectitude on the part of developed nation governments – I believe there are two factors which are key for stock markets over the next few years, inflation and employment. The fact that these also happen to be the two mandated targets of the Federal Reserve – full employment and price stability – is more than coincidental. My struggle is in attempting to decide whether demand-pull inflation can survive the impact of a rapid rise in unemployment come the next recession.
Inflation and the Central Bankers response is clearly the new narrative of the financial markets. In his latest essay, Ben Hunt of Salient Partners makes some fascinating observations – Epsilon Theory: The Narrative Giveth and The Narrative Taketh Away:
This market, like all markets, cares about two things and two things only — the price of money and the real return on invested capital. Or, as they are typically represented in cartoon form, interest rates and growth.
…This market, like all markets, needs a positive narrative on risk (the price of money) or reward (the real return on capital) to go up. Any narrative will do! But when neither risk nor reward is represented with a positive narrative, this market, like all markets, will go down. And that’s where we are today.
Does the Fed have our back? No, they do not. They’ve told us and told us that they’re going to keep raising rates. And they will. The market still doesn’t fully believe them, and that’s going to be a constant source of market disappointment over the next few years. In the same way that markets go up as they climb a wall of worry, so do markets go down as they descend a wall of hope. The belief that central bankers care more about the stock market than the price stability of money is that wall of hope. It’s a forlorn hope.
The author goes on to discuss the way that inflation and the war on trade has derailed the global synchronized growth narrative. Dr Hunt writes at length about narratives; those who have been reading my letters for a while will know I regularly quote from his excellent Epsilon Theory.
The narrative has not yet become flesh, to coin a phrase, but in the author’s opinion it will:
My view: the inflation narrative will surge again, as wage inflation is, in truth, not contained at all.
The trade war narrative hit markets in force in late February with the White House announcement on steel and aluminum tariffs. It subsided through mid-March as hope grew that Trump’s bark was worse than his bite, then resurfaced in late March with direct tariff threats against China, then subsided again on hopes that direct negotiations would contain the conflict, and has now resurfaced this past week with still more direct tariff threats against and from China. Already this weekend you’ve got Kudlow and other market missionaries trying to rekindle the hope of easy negotiations. But being “tough on trade” is a winning domestic political position for both Trump and Xi, and domestic politics ALWAYS trumps (no pun intended) international economics.
My view: the trade war narrative will be spurred on by BOTH sides, and is, in truth, not contained at all.
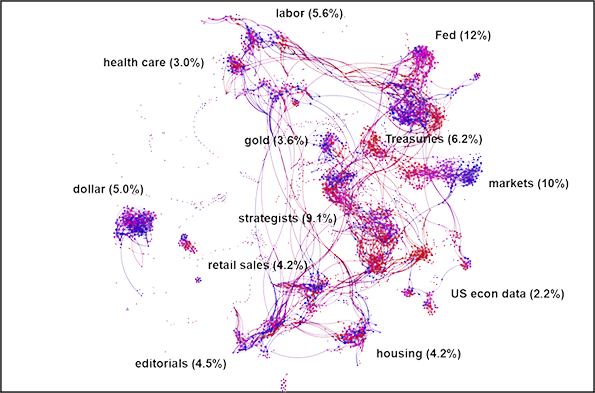
The two charts below employ natural language processing techniques. They show how the inflation narrative has rapidly increased during the last 12 months. I shall leave Dr Hunt to elucidate:
… analysis of a large set of market relevant articles — in this case everything Bloomberg has published that talks about inflation — where linguistic similarities create clusters of articles with similar meaning (essentially a linguistic “gravity model”), and where the dynamic relationships between and within these clusters can be measured over time.

Source: Quid.inc
What this chart shows is the clustering of content in 1,400 Bloomberg articles, which mention US inflation, between April 2016 and March 2017. The graduated colouring – blue earlier and red later in the year – enriches the analysis.
The next chart is for the period April 2017 to March 2018:
Source: Quid.Inc
During this period there were 2,400 articles (a 75% increase) but, of more relevance is the dramatic increase in clustering.
What is clear from these charts is the rising importance of inflation as a potential driver of market direction. Yet there are contrary signals that suggest that economic and employment growth are already beginning to weaken. Can inflation continue to rise in the face of these headwinds. Writing in The Telegraph, Ambrose Evans-Pritchard has his doubts (this transcript is care of Mauldin Economics) – JP Morgan fears Fed “policy mistake” as US yield curve inverts:
US jobs growth fizzled to stall-speed levels of 103,000 in March. The worldwide PMI gauge of manufacturing and services has dropped to a 14-month low. The average “Nowcast” tracker of global growth has slid suddenly to a quarterly rate of 3.2pc from 4.1pc as recently as early February.
Analysts at JP Morgan say the forward curve for the one-month Overnight Index Swap rate (OIS) – a market proxy for the Fed policy rate – has flattened and “inverted” two years ahead. This is a collective bet by big institutional investors and fund managers that interest rates may be falling by then.
…The OIS yield curve has inverted three times over the last two decades. In 1998 it proved to be a false alarm because the Greenspan Fed did a pirouette and flooded the system with liquidity. In 2000 it was a clear precursor of recession. In 2005 it signaled that the US housing boom was already starting to deflate.
…Growth of the “broad” M3 money supply in the US has slowed to a 2pc rate over the last three months (annualised)…pointing to a “growth recession” by early 2019. Narrow real M1 money has actually contracted slightly since November.
…RBC Capital Markets says this will drain M3 money by roughly $300bn a year…
…Three-month Libor rates – used to set the cost of borrowing on $9 trillion of US and global loans, and $200 trillion of derivatives – have surged 60 basis points since January.
…The signs of a slowdown are even clearer in Europe…Citigroup’s economic surprise index for the region has seen the worst four-month deterioration since 2008. A reduction in the pace of QE from $80bn to $30bn a month has removed a key prop. The European Central Bank’s bond purchase programme expires altogether in September.
…The global money supply has been slowing since last September. The Baltic Dry Index measuring freight rates for dry goods peaked in mid-December and has since dropped 45pc.
Which brings us neatly to the commodity markets. Are real assets a safe place to hide in the coming inflationary (or perhaps stagflationary) environment? Will the lack of capital investment, resulting from the weakness in commodity prices following the financial crisis, feed through to cost-push inflation?
The Trouble with Commodities
Commodities are an excellent portfolio diversifier because they tend to be uncorrelated with stock, bonds or real estate. They have a weakness, however, since to invest in commodities one needs to accept that over the long run they have a negative real-expected return. Why? Because of man’s ingenuity. We improve our processes and invest in new technologies which reduce our production costs. We improve extraction techniques and enhance acreage yields. You cannot simply buy and hold commodities: they are trading assets.
Demand and supply of commodities globally is a complex challenge to measure; for grains, oilseeds and cotton the USDA World Agricultural Supply and Demand Estimates for March offers a fairly balanced picture:
World 2017/18 wheat supplies increased this month by nearly 3.0 million tons as production is raised to a new record of 759.8 million
Global coarse grain production for 2017/18 is forecast 7.0 million tons lower than last month to 1,315.0 million
Global 2017/18 rice production is raised 1.2 million tons to a new record led by 0.3- million-ton increases each for Brazil, Burma, Pakistan, and the Philippines. Global rice exports are raised 0.8 million tons with a 0.3-million-ton increase for Thailand and 0.2- million-ton increases each for Burma, India, and Pakistan. Imports are raised 0.5 million tons for Indonesia and 0.3 million tons for Bangladesh. Global domestic use is reduced fractionally. With supplies increasing and total use decreasing, world ending stocks are raised 1.4 million tons to 144.4 million and are the second highest stocks on record.
Global oilseed production is lowered 5.7 million tons to 568.8 million, with a 6.1-million-ton reduction for soybean production and slightly higher projections for rapeseed, sunflower seed, copra, and palm kernel. Lower soybean production for Argentina, India, and Uruguay is partly offset by higher production for Brazil.
Cotton – Lower global beginning stocks this month result in lower projected 2017/18 ending stocks despite higher world production and lower consumption. World beginning stocks are 900,000 bales lower this month, largely attributable to historical revisions for Brazil and Australia. World production is about 250,000 bales higher as a larger Brazilian crop more than offsets a decline for Sudan. Consumption is about 400,000 bales lower as lower consumption in India, Indonesia, and some smaller countries more than offsets Vietnam’s increase. Ending stocks for 2017/18 are nearly 600,000 bales lower in total this month as reductions for Brazil, Sudan, the United States, and Australia more than offset an increase for Pakistan.
It is worth remembering that local market prices can be dramatically influenced by small changes in regional supply or demand and the vagaries of supply chain logistics. Added to which, for US grains there is heightened anxiety regarding tariffs: they are expected to be the main target of the Chinese retaliation.
Here is the price of US Wheat since 2007:

Source: Trading Economics
Crisis? What crisis? It is still near to multi-year lows, although above the nadir of the financial crisis in 2009.
The broader CRB Index shows a more pronounced recovery, it has been rising since the beginning of 2016:

Source: Reuters, Core Commodity Indexes
Neither of these charts suggest that price momentum is that robust.
Another (and, perhaps, more global) measure of economic activity is the Baltic Dry Freight Index. This chart shows a very different reaction to the synchronised increase in world economic growth:

Source: Quandl
In absolute terms the index has more than tripled in price from the 2016 low, nonetheless, it is still in the lower half of the range of the past decade.
Global economic growth may have encouraged a rebound in Copper, another industrial bellwether, but it appears to have lost some momentum of late:
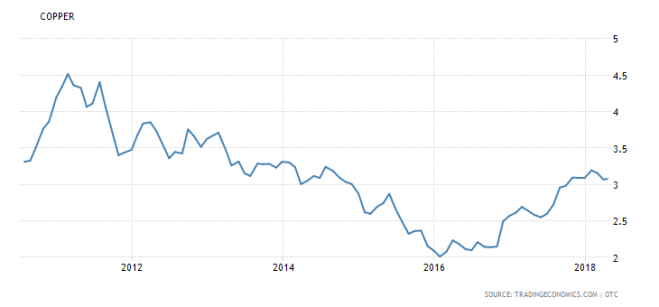
Source: Trading Economics
Brent Crude Oil also appears to be benefitting from the increase in economic activity. It has doubled from its low of two years ago. The US rig count has increased in response but at 800 it remains at half the level of a few years ago:-

Source: Trading Economics
US Natural Gas, which might still manage an upward price spike on account of the unseasonably cold weather in the US, provides a less compelling argument:
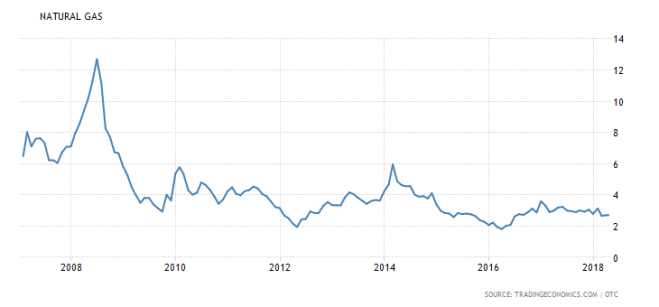
Source: Trading Economics
Commodity markets are clearly off their multi-year lows, but the strength of momentum looks mixed and, in grains and oil seeds, global supply and demand look fairly balanced. Cost push inflation may be a factor in certain markets, but, without price-pull demand, inflation pressures are likely to be short-lived. Late cycle increases in commodity prices are quite common, however, so we may experience a short-run stagflationary squeeze on incomes.
Conclusions and Investment Opportunities
When ever I write about commodities in a collective way, I remind readers that each market is unique, pretending they are homogenous is often misleading. The recent rise in Cocoa, after a two-year downtrend resulting from an increase in global supply, is a classic example. The time it takes to grow a Cocoa plant governs the length of the cycle. Similarly, the lead time for producing a new ship is a major factor in determining the length of the freight rate cycle. Nonetheless, at the risk of contradicting myself, what may keep a bid under commodity markets is the low level of capital investment which has been a hall-mark of the long, listless recovery from the great financial recession. I believe an economic downturn is likely and job losses will occur rapidly in response.
I entitled this letter ‘Inflation or Employment’, these are the factors which will dominate Central Bank policy. Currently commentators view inflation as the greater concern, as Dr Hunt’s research indicates, but I believe those Central Bankers who can (by which I mean the Federal Reserve) will attempt to insure they have raised interest rates to a level from which they can be cut, rather than having to rely on ever more unorthodox monetary policies.


Leave your comments
Post comment as a guest