Global Real Estate and the end of QE – Is it time to be afraid?

Colin lloyd 03/11/2017 8


During the past two months two of the world’s leading central banks have begun the process of unwinding or, at least, tapering the quantitative easing which was first initiated after the great financial recession of 2008/2009. The Federal Reserve FOMC statement for September and their Addendum to the Policy Normalization Principles and Plans from June contain the details of the US bank’s policy change. The ECB Monetary policy decision from last week explains the European position.


Whilst the Federal Reserve is reducing its balance sheet by allowing US treasury holdings to mature, the US government has already breached its debt ceiling and will need to issue new bonds. The pace of US money supply growth is unlikely to be reversed. Nonetheless, 10yr US bond yields have risen from a low of 1.35% in July 2016 to more than 2.6% earlier this year. They currently yield around 2.4%. Over the same period 2yr US bond yields have risen from 0.49% to a new high, this week, of 1.60% - their highest since October 2008.


Back in April I wrote about the anomaly in the US interest rate swaps market - US 30yr Swaps have yielded less than Treasuries since 2008 – does it matter? What is interesting to note, in relation to global real estate, is that the 10yr Swap spread over US Treasuries (which is currently negative) has remained stable at -8bp during the recent rise in yields. Normally as interest rates on government bonds declines credit spreads tighten – as rates rise these spreads widen. So far, this has not come to pass.


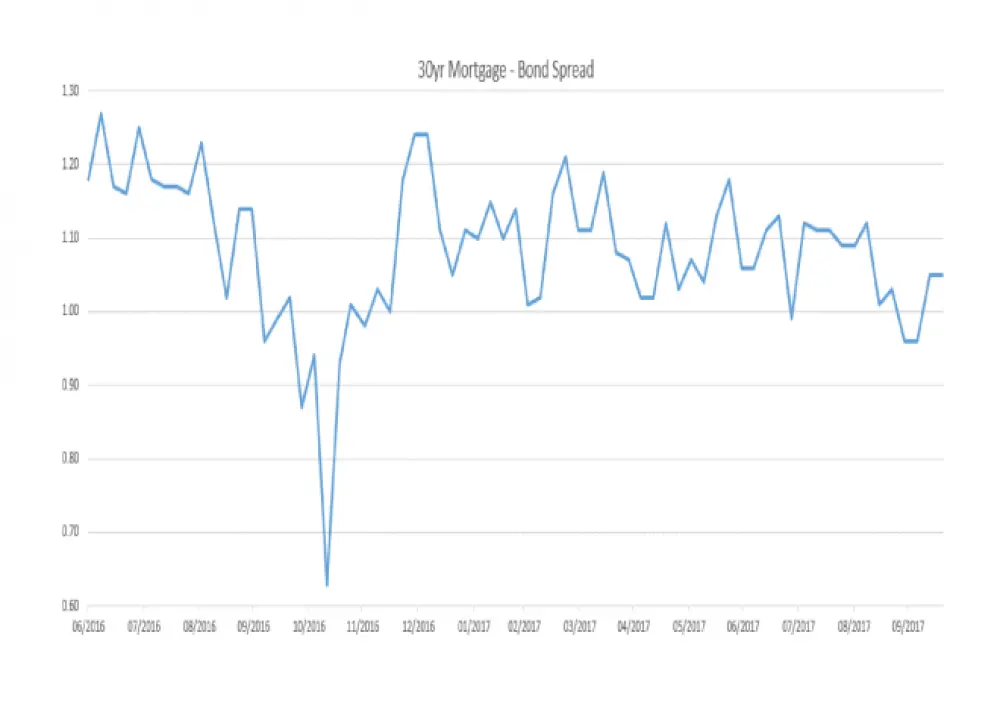
In the US, mortgages are, predominantly, long-term and fixed rate. US 30yr mortgage rates has also risen since July 2016 – from 2.09% to 3.18% at the end of December. Since then rates have moderated, they now stand at 2.89%, approximately 1% above US 30yr bonds. The chart below shows the spread since July 2016:


Source: Federal Reserve Bank of St Louis


Apart from the aberration during the US presidential elections the spread between 30yr US Treasuries and 30yr Mortgages has been steadily narrowing despite the tightening of short term interest rates and the increase in yields across the maturity spectrum.


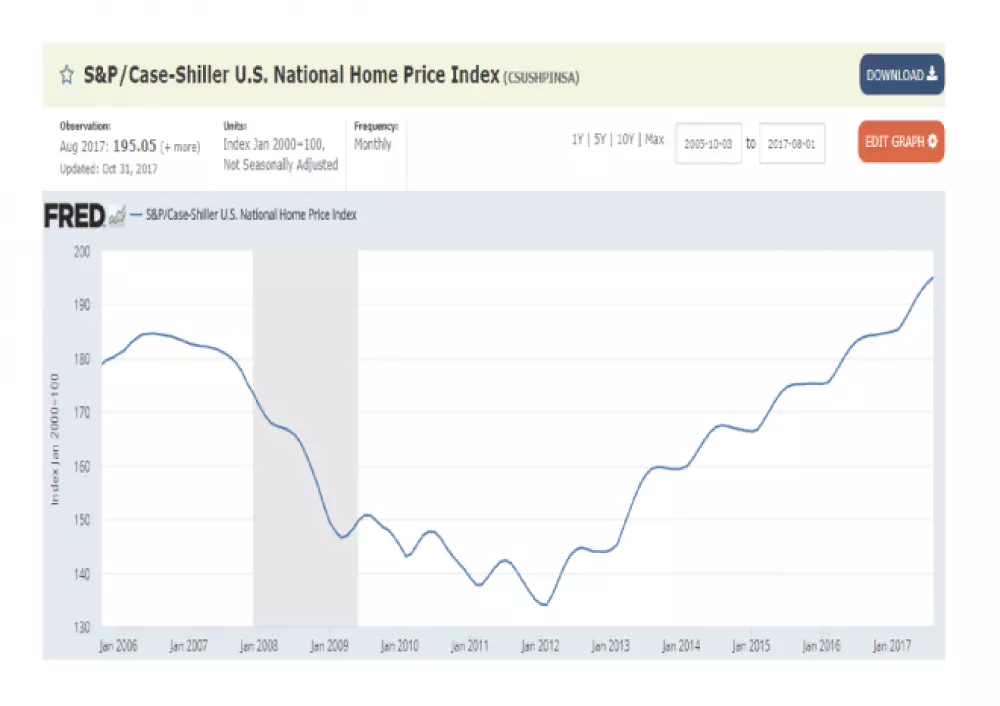
Mortgage finance costs have increased since July 2016 but by less than 50bp. What impact has this had on real estate prices? The chart below shows the S&P Case-Shiller House Price Index since 2006, the increase in mortgage rates has failed to slow the rise in prices. The year on year increase is currently running at 5.6% and forecasters predict this rate to increase to 5.8% when September data is released:

Source: Federal Reserve Bank of St Louis, S&P Case-Shiller


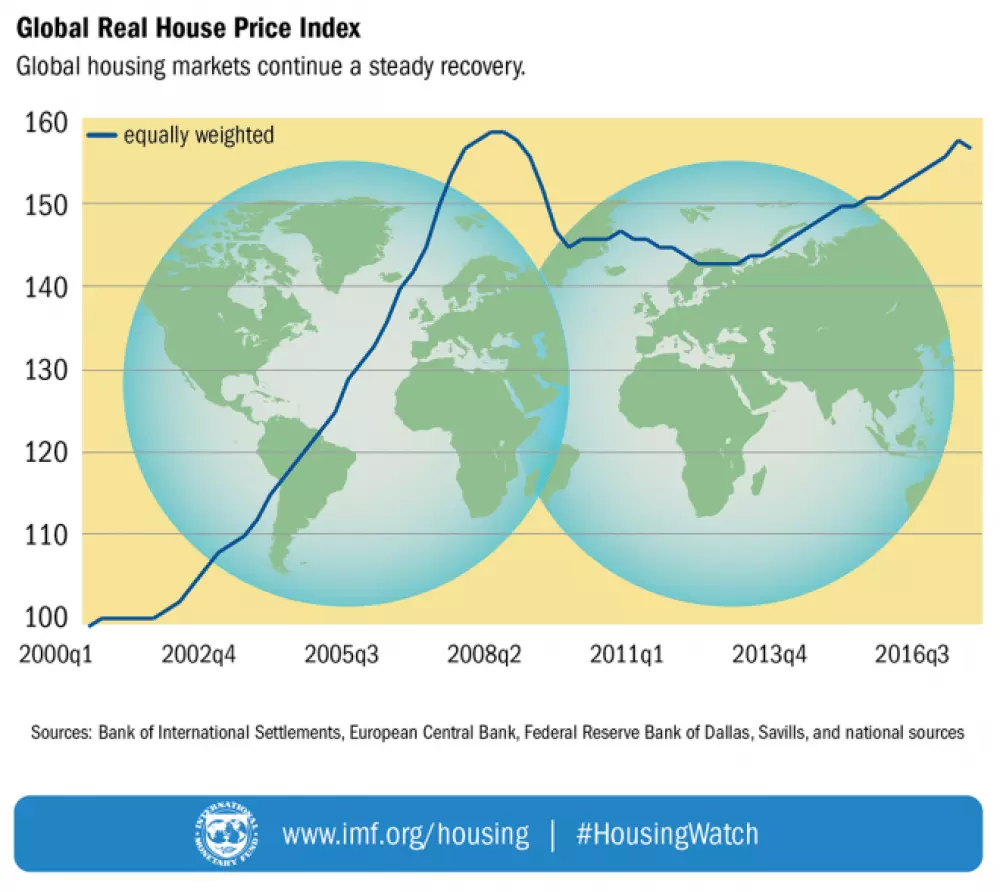
At the global level house prices have not taken out their pre-crisis highs, as this chart from the IMF reveals:


Source: IMF, BIS, ECB, Federal Reserve, Savills


The latest IMF – Global Housing Watch – report for Q2 2017 is sanguine. They take comfort from the broad range of macroprudential measures which have been introduced during the past decade.


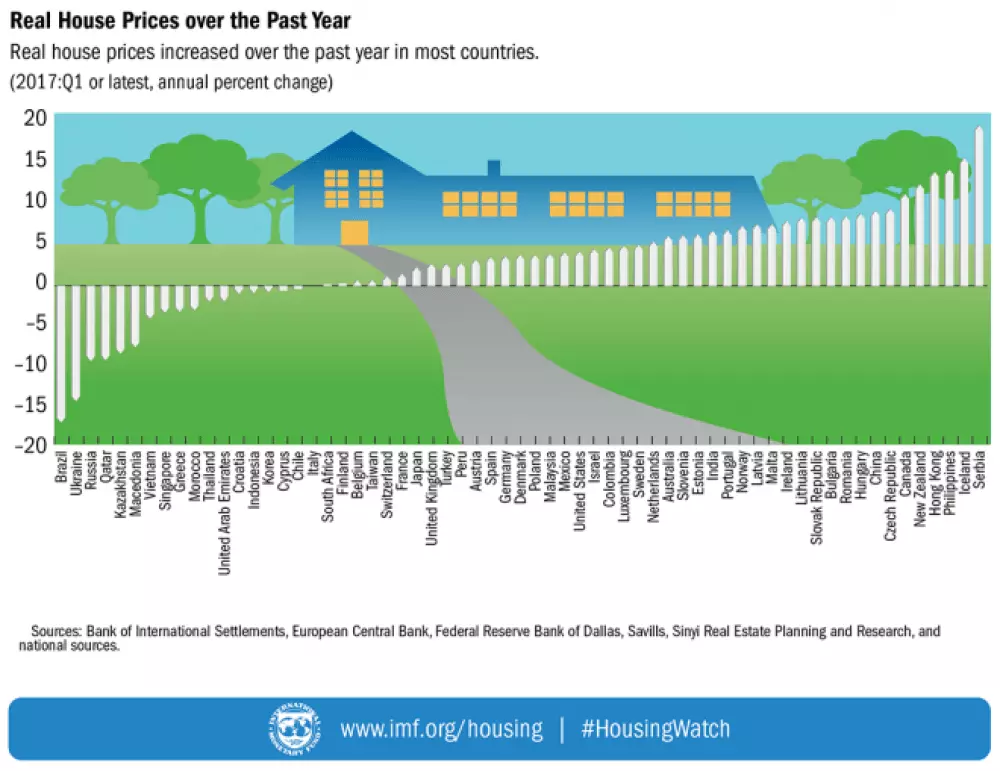
The IMF go on to examine house price increases on a country by country basis:


Source: IMF, BIS, ECB, Federal Reserve, Savills, Sinyl Real Estate


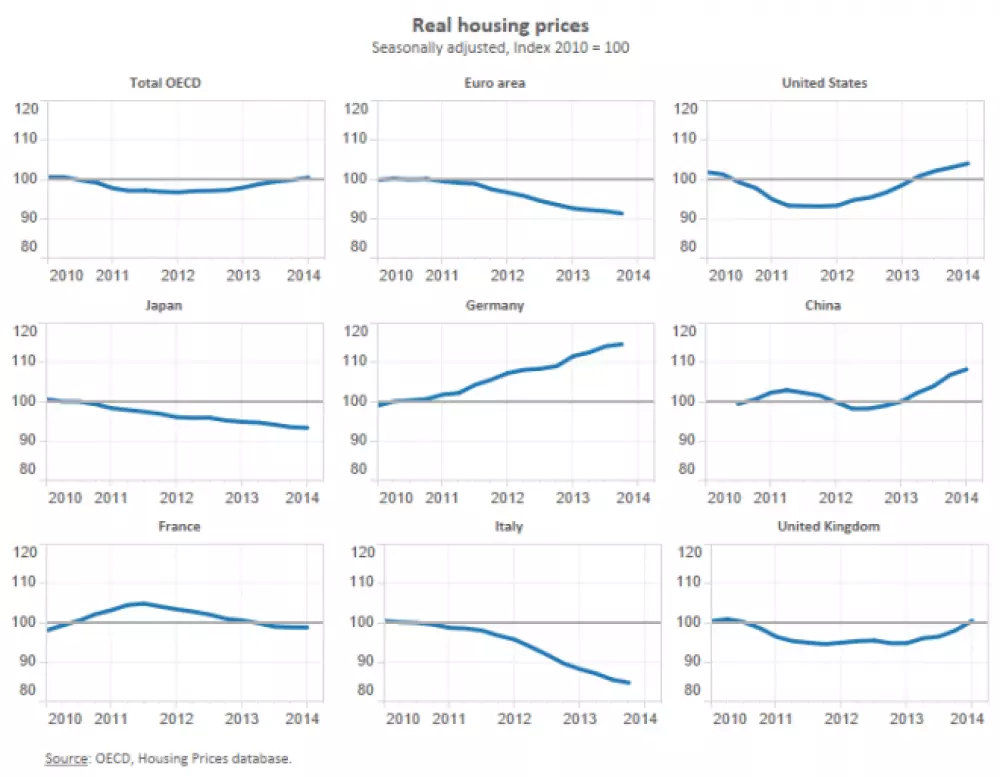
The OECD – Focus on house prices – looks at a variety of different metrics including changes in real house prices: the OECD average is more of less where it was in 2010 having dipped during 2011/2012 – here is breakdown across a selection of regions. Please note the charts are rather historic they stop at January 2014:


Source: OECD


The continued fall in Japanese prices is not entirely surprising but the steady decline of the Euro area is significant.


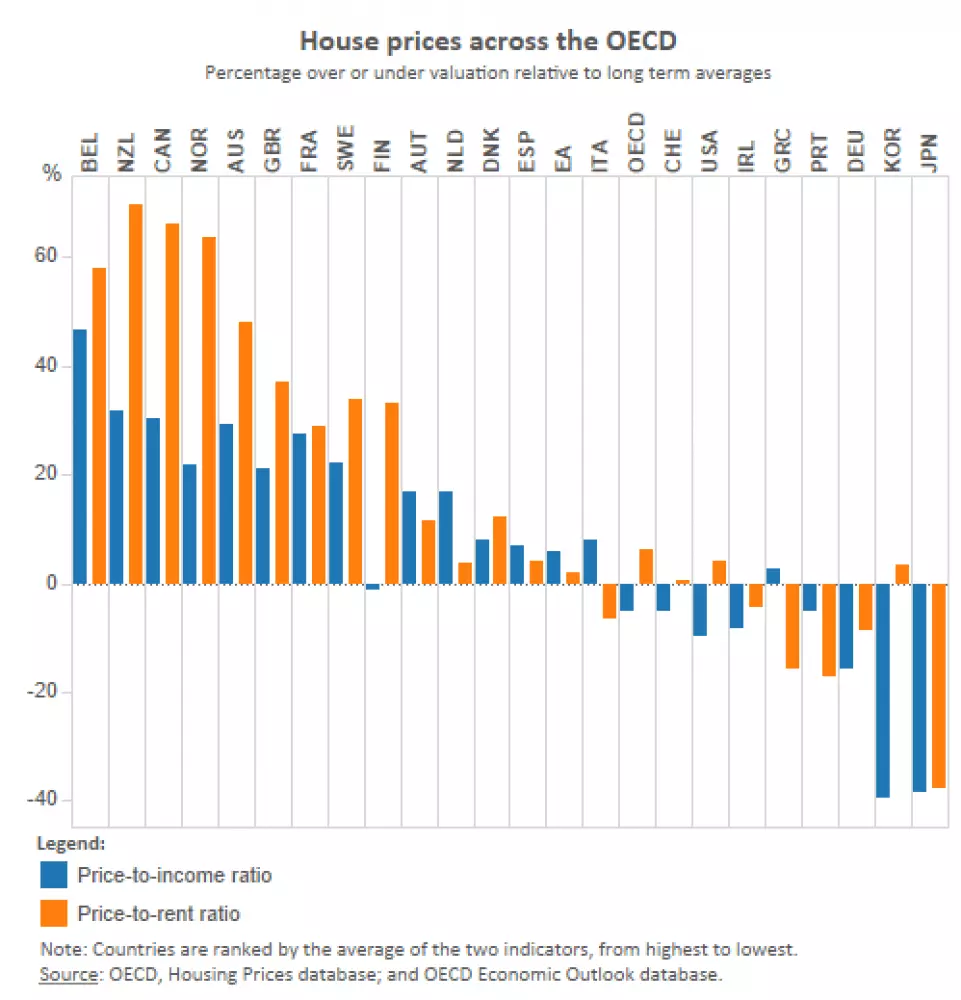
Similarly historic data is contained in the chart below which ranks countries by Price to Income and Price to Rent. Portugal, Germany, South Korea and Japan remain inexpensive by these measures, whilst Belgium, New Zealand, Canada, Norway and Australia remain expensive. The UK market also appears inflated but the decline in Sterling may be a supportive factor: international capital is flowing into the UK after the devaluation:


Source: OECD


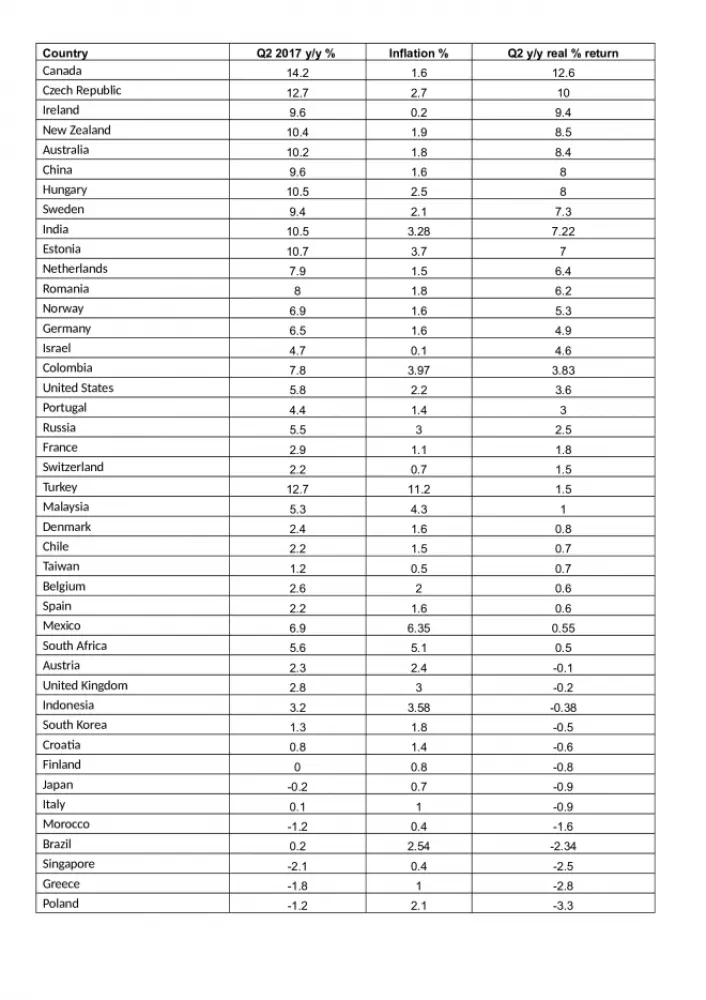
Bringing the data up to date is the Knight Frank's global house price index, for Q2 2017. The table below is sorted by real return:

Source: Knight Frank, Trading Economics


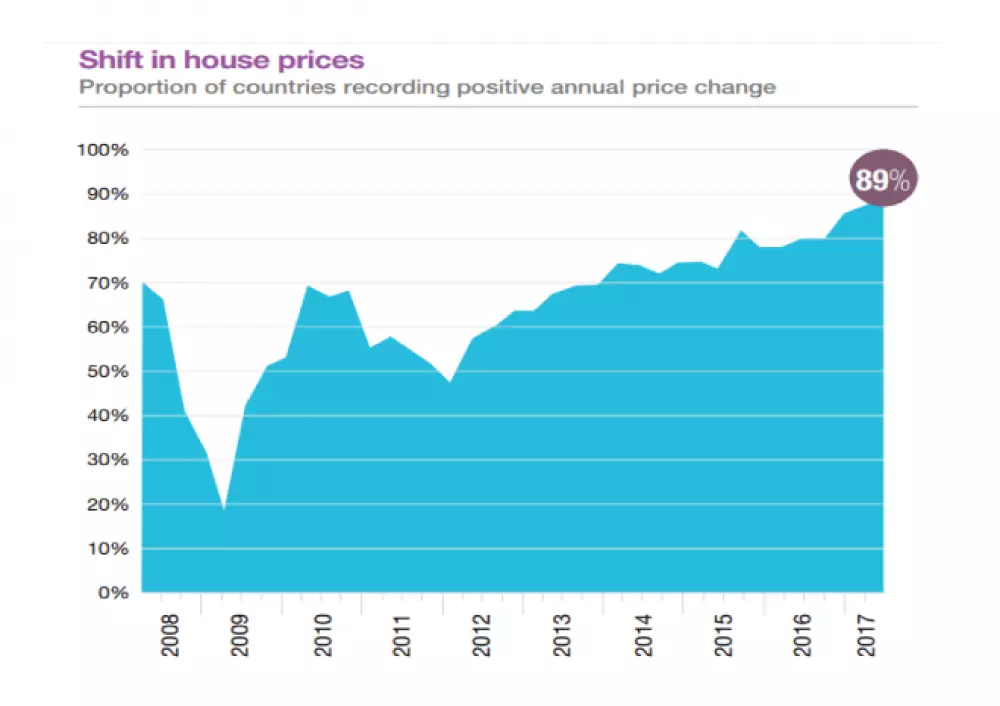
There is a saying in the real estate market, ‘all property is local’. Prices vary from region to region, from street to street, however, the data above paints a picture of a global real estate market which has performed strongly in response to the lowering of interest rates. As the table below illustrates, the percentage of countries recording positive annual price changes is now at 89%, well above the levels of 2007, when interest rates were higher:


Source: Knight Frank


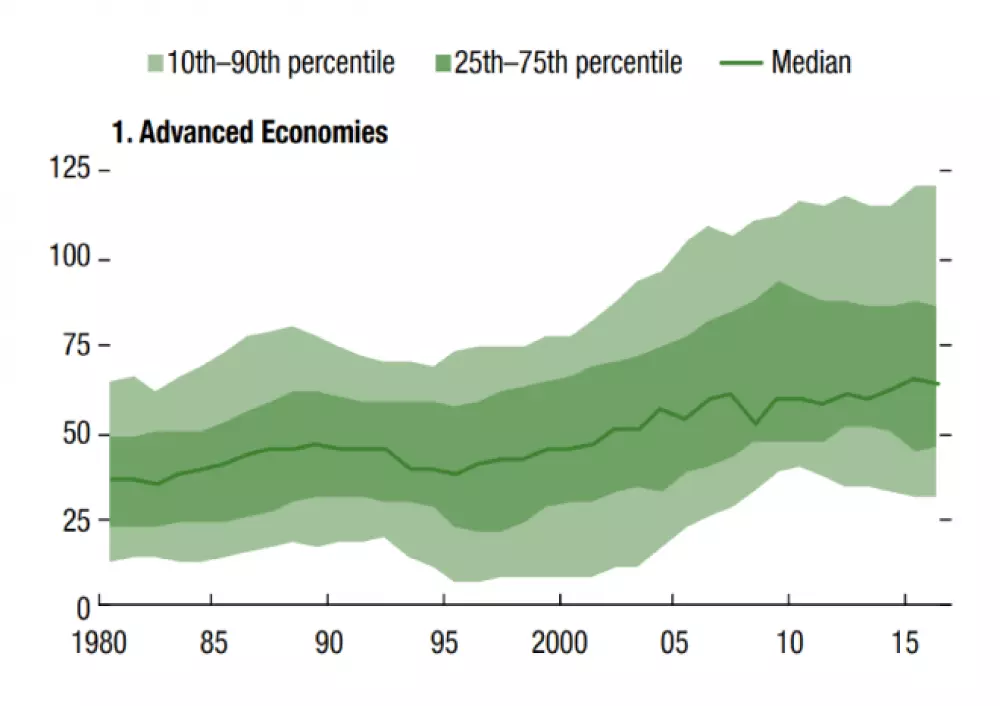
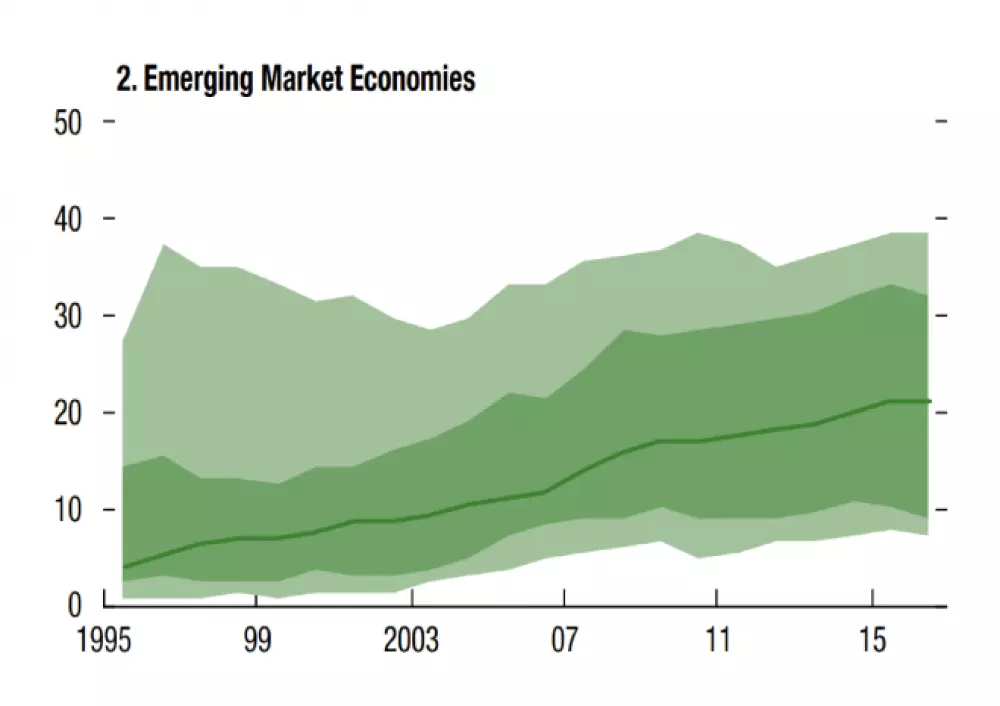
The low interest rate environment has stimulated a rise in household debt, especially in advanced economies. The IMF - Global Financial Stability Report October 2017 makes sombre reading:

Although finance is generally believed to contribute to long-term economic growth, recent studies have shown that the growth benefits start declining when aggregate leverage is high. At business cycle frequencies, new empirical studies—as well as the recent experience from the global financial crisis—have shown that increases in private sector credit, including household debt, may raise the likelihood of a financial crisis and could lead to lower growth.

These two charts show the rising trend globally but the relatively undemanding levels of indebtedness typical of the Emerging Market countries:


Source: IMF


Source: IMF


As long ago at February 2015 – McKinsey – Debt and (not too much) deleveraging – sounded the warning knell:


Seven years after the bursting of a global credit bubble resulted in the worst financial crisis since the Great Depression, debt continues to grow. In fact, rather than reducing indebtedness, or deleveraging, all major economies today have higher levels of borrowing relative to GDP than they did in 2007. Global debt in these years has grown by $57 trillion, raising the ratio of debt to GDP by 17 percentage points.


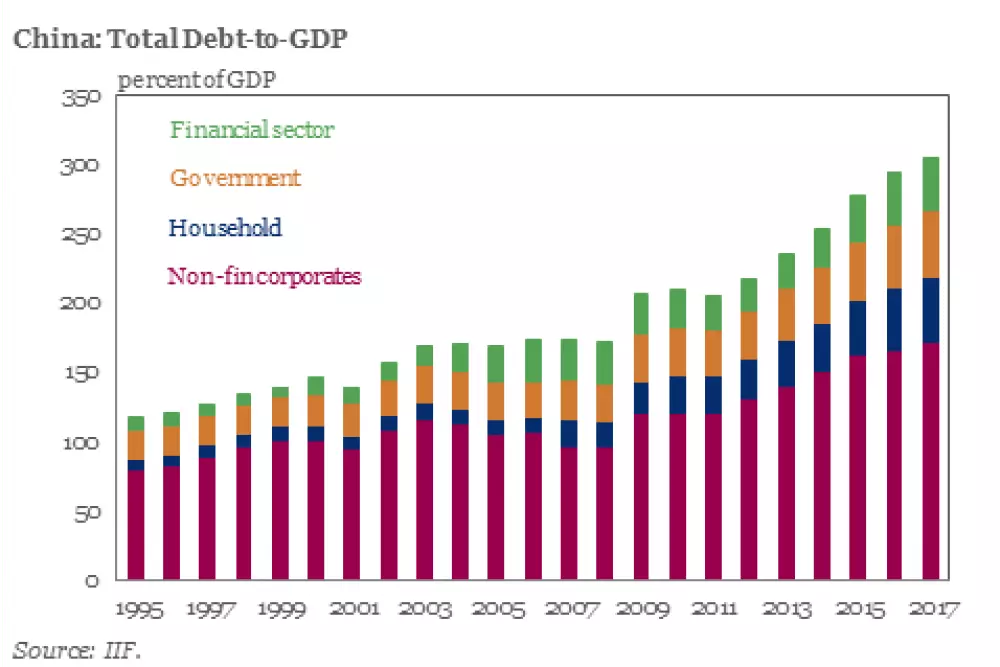
According to the Institute of International Finance Q2 2017 global debt report - debt hit a new all- time high of $217 trln (327% of global GDP) with China leading the way:


Household debt is growing in China but from a relatively low base, it is as the IMF observe, the advanced economies where households are becoming addicted to low interest rates and cheap finance.


Conclusions and investment opportunities


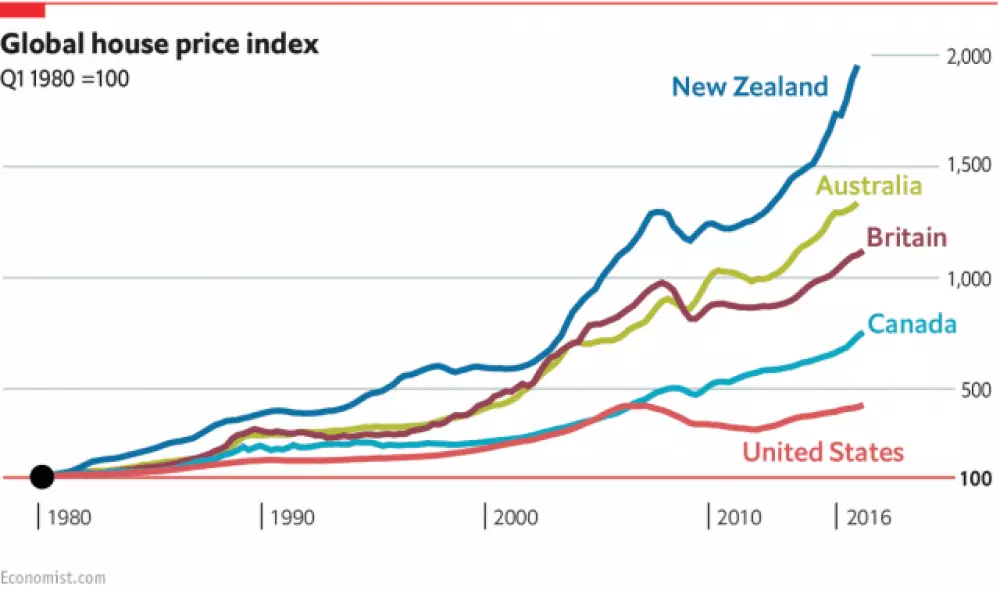
Source: The Economist


The chart above shows a few of the winners since 1980. The real estate market remains sanguine, trusting that the end of QE will be a gradual process. Although as a recent article by Frank Shostak – Can gradual interest rate tightening prevent shocks? reminds us, ‘...there is no such thing as “shock- free” monetary policy’:


Can a gradual tightening prevent an economic bust? Since monetary growth, whether expected or unexpected, gives rise to the redirection of real savings it means that any monetary tightening slows down this redirection. Various economic activities, which sprang-up on the back of strong monetary pumping, because of a tighter monetary stance get now less real funding. This in turn means that these activities are given less support and run the risk of being liquidated. It is the liquidation of these activities what an economic bust is all about.Obviously, then, the tighter monetary stance by the Fed must put pressure on various false activities, or various artificial forms of life.


Hence, the tighter the Fed gets the slower the pace of redirection of real savings will be, which in turn means that more liquidation of various false activities will take place. In the words of Ludwig von Mises, 


‘The boom brought about by the banks’ policy of extending credit must necessarily end sooner or later. Unless they are willing to let their policy completely destroy the monetary and credit system, the banks themselves must cut it short before the catastrophe occurs. The longer the period of credit expansion and the longer the banks delay in changing their policy, the worse will be the consequences of the malinvestments and of the inordinate speculation characterizing the boom; and as a result the longer will be the period of depression and the more uncertain the date of recovery and return to normal economic activity.’

Consequently, the view that the Fed can lift interest rates without any disruption doesn’t hold water. Obviously if the pool of real savings is still expanding then this may mitigate the severity of the bust. However, given the reckless monetary policies of the US central bank it is quite likely that the US economy may already has a stagnant or perhaps a declining pool of real savings. This in turn runs the risk of the US economy falling into a severe economic slump. We can thus conclude that the popular view that gradual transparent monetary policies will allow the Fed to tighten its stance without any disruptions is based on erroneous ideas.

There is no such thing as a “shock-free” monetary policy any more than a monetary expansion can ever be truly neutral to the market. Regardless of policy transparency once a tighter monetary stance is introduced, it sets in motion an economic bust. The severity of the bust is conditioned by the length and magnitude of the previous loose monetary stance and the state of the pool of real savings.


If world stock markets catch a cold, central banks will provide assistance - though not perhaps to the same degree as they did last time around. If, however, the real estate market begins to unravel the impact on consumption - and therefore on the real economy – will be much more dramatic. Central bankers will act in concert and with determination. If the problem is malinvestment due to artificially low interest rates, then further QE and a return to the zero bound will not cure the malady: but this discussion is for another time.


What does quantitative tightening – QT – mean for real estate? In many urban areas, the increasing price of real estate is a function of geography and the limitations of infrastructure. Shortages of supply are difficult (and in some cases impossible) to alleviate; it is unlikely, for example, that planning consent would be granted to develop Central Park in Manhattan or Hyde Park in London.


Higher interest rates and weakness in household earnings growth will temper the rise in property prices. If the markets run scared it may even lead to a brief correction. More likely, transactional activity will diminish. A price collapse to the degree we witnessed in 2008/2009 is unlikely to recur. Those markets which have risen most may exhibit a greater propensity to decline, but the combination of steady long term demand and supply constraints, will, if you’ll pardon the pun, underpin global real estate.

Leave your comments

Post comment as a guest

0
terms and condition.
  • Frank Delon

    Based on a recent report that I have read, house prices in the city of London are expected to fall 1.5% in 2017 and 2% in the following year. The capital is forecast to lag well behind other regions over the next five years.

  • Kobe Pierce

    Good post, enjoyed reading your latest macro analysis.

  • Amy Lowis

    China’s outbound investment is behind South Korea and Japan, with only about 4% of its total wealth being invested in foreign nations. The country still has more room to grow. Any monetary changes that will occur are most likely short term.

  • John Hann

    Interestingly, Germany has leapfrogged the U.K. to become investors' favourite European real estate investment location, pouring in €54 billion.

  • Yorkshire Lad

    Real estate investments have fallen from £58 billion to £56 billion. London is the only city in Europe in which rent prices are likely to continue to fall this year.

  • Kirill Kondrachov

    Keep up the good work

  • Deepak Sethi

    Thanks for sharing your knowledge with us sir.

  • Samantha

    Brillant

Save
Cookies user prefences
We use cookies to ensure you to get the best experience on our website. If you decline the use of cookies, this website may not function as expected.
Accept all
Decline all
Read more
Analytics
Tools used to analyze the data to measure the effectiveness of a website and to understand how it works.
Google Analytics
Accept
Decline