Comments
- No comments found
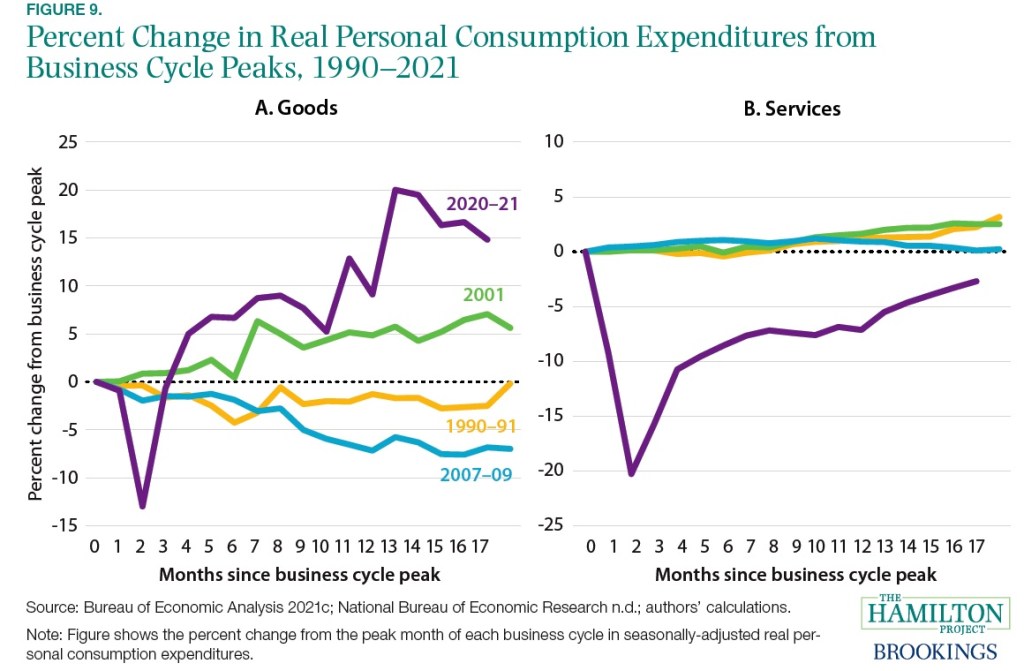
In most recessions, consumption of services doesn’t move much, while consumption of goods drops fairly sharply and then rebounds over time.
The short, sharp pandemic recession was different. With a combination of stay-at-home behavior, risk aversion, and official lockdowns, consumption of services dropped substantially and has not yet fully recovered. Meanwhile, consumption of goods dropped briefly, but quickly rebounded to above the pre-pandemic levels.
Mitchell Barnes, Lauren Bauer, and Wendy Edelberg provide a useful figure illustrating these dynamics for one of their “11 Facts on the Economic Recovery from the COVID-19 Pandemic” (Hamilton Project at the Brookings Institution, September 2021). They point out that the US economy has re-attained its pre-pandemic size in the second quarter of this year. But as production of services has not yet fully recovered, production of goods has climbed. The four lines on each graph show the four most recent recessions. The purple line shows the unusually high rise in goods consumption on the left and the unusual drop in services consumption on the right.
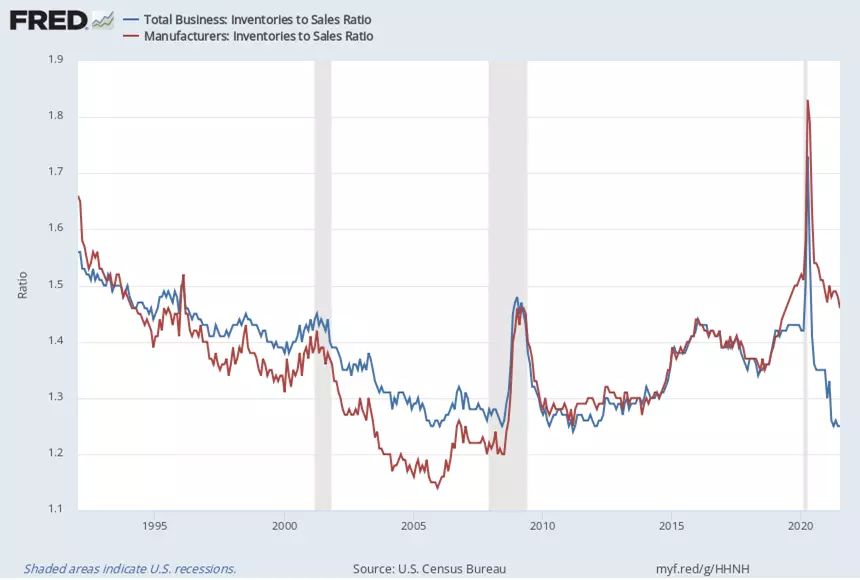
This unexpectedly high consumption of goods, combined with disruptions of supply chains, has created some unusual situations for inventories–that is, what is being held in stock to be sold later. Overall inventories held by businesses can be divided up into three categories: held by manufacturers, held by wholesalers, and what’s held by retailers.
The blue line in this figure shows overall business inventories, measured relative to sales. As you can see, inventories rise during recessions, as unsold goods sit on the shelves. Firms then reduce their ordering, and when demand picks up again after the recession, inventories drop for a time. One interesting fact is that the overall level of business inventories (blue line) has not dropped to unprecedented levels–it’s a 1.25 multiple of sales, similar to levels before and after the Great Recession. But if you focus in on retail inventories, shown by the red line, you can see that retailers (understandably) tended to hold more inventory than the business sector as a whole before the pandemic. But retail inventories have plunged to historically low levels, below the overall levels for the business sector as a whole.
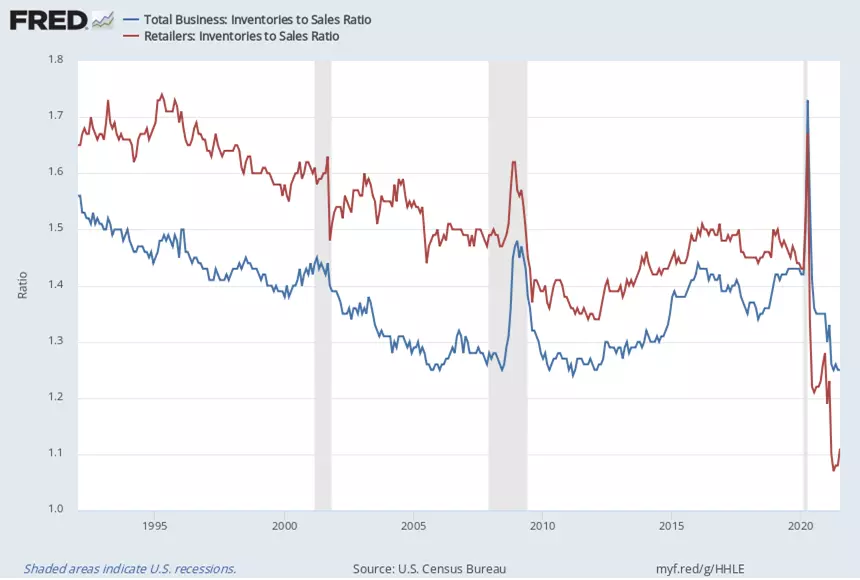
A more detailed breakdown within the retail category shows that some of the sectors with the biggest drop in inventories are motor vehicles, clothing stores, and department stores.
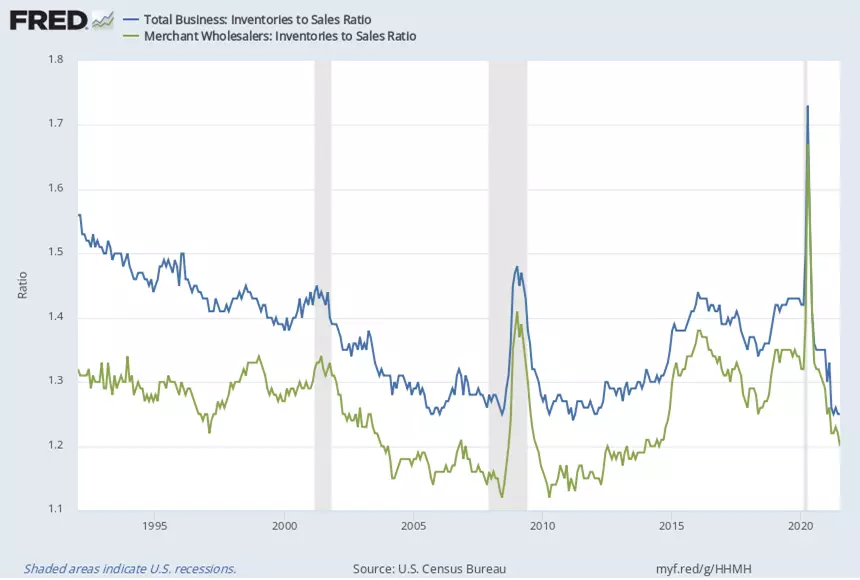
What about the wholesalers who supply the retailers? Their inventories peaked and dropped as well but not as severely. Again, the blue line shows inventories for the overall business sector as a basis for comparison, but the green shows inventories for wholesalers. Their inventory levels are low–for example, it’s not obvious that they have a backlog of inventories waiting to be passed along to the retailers–but the overall level of inventories for wholesalers is not ultra-low compared to pre-pandemic levels.
What about manufacturers? Again, the blue line shows inventories for the overall business sector, one more time, while this time the red line shows inventories for manufacturers. These inventories show the spike and fall one would expect, but overall, they don’t appear that low. On the other hand, I’ve been reading here and there about shortages for manufacturers of specific inputs, like computer chips used by car manufacturers. Perhaps manufacturers are holding inventories of some inputs because they are hampered by shortages of other inputs.
These shifts in goods, services, and inventories are of course reflected in adjustments in actual jobs and businesses. By the standards of past recessions, the dislocations in services industries were much larger and longer than would have been expected, while in goods industries, the rebound was stronger than would have been expected.
Timothy Taylor is an American economist. He is managing editor of the Journal of Economic Perspectives, a quarterly academic journal produced at Macalester College and published by the American Economic Association. Taylor received his Bachelor of Arts degree from Haverford College and a master's degree in economics from Stanford University. At Stanford, he was winner of the award for excellent teaching in a large class (more than 30 students) given by the Associated Students of Stanford University. At Minnesota, he was named a Distinguished Lecturer by the Department of Economics and voted Teacher of the Year by the master's degree students at the Hubert H. Humphrey Institute of Public Affairs. Taylor has been a guest speaker for groups of teachers of high school economics, visiting diplomats from eastern Europe, talk-radio shows, and community groups. From 1989 to 1997, Professor Taylor wrote an economics opinion column for the San Jose Mercury-News. He has published multiple lectures on economics through The Teaching Company. With Rudolph Penner and Isabel Sawhill, he is co-author of Updating America's Social Contract (2000), whose first chapter provided an early radical centrist perspective, "An Agenda for the Radical Middle". Taylor is also the author of The Instant Economist: Everything You Need to Know About How the Economy Works, published by the Penguin Group in 2012. The fourth edition of Taylor's Principles of Economics textbook was published by Textbook Media in 2017.
BBN Times connects decision makers to you. Experts in their fields, worth listening to, are the ones who write our articles. We believe these are the real commentators of the future. We quickly and accurately deliver serious information around the world. BBN Times provides its readers human expertise to find trusted answers by providing a platform and a voice to anyone willing to know more about the latest trends. Stay tuned, the revolution has begun.
Leave your comments
Post comment as a guest