Comments
- No comments found

Each year in September, the US Census Bureau releases a report on income and poverty measures for the previous year.
Thus, Income and Poverty in the United States: 2020, by Emily A. Shrider, Melissa Kollar, Frances Chen, and Jessica Semega (September 2021) looks at changes for 2020. As one would expect, given the pandemic, the poverty rate in 2020 rose.
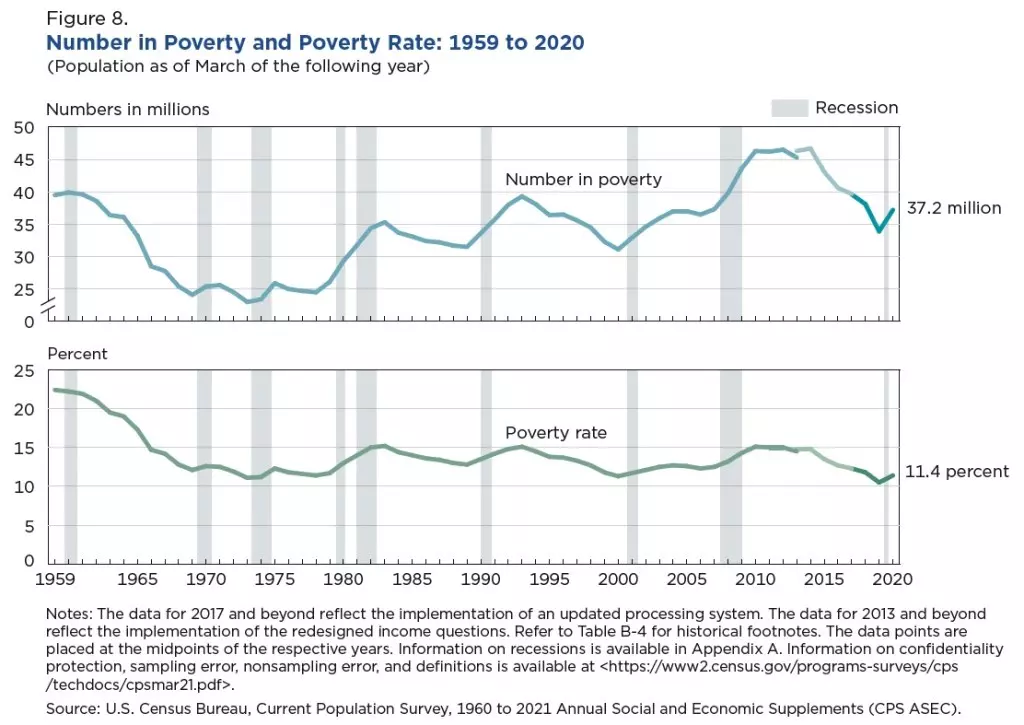
This figure shows the poverty rate in the top graph and the number of people in poverty in the bottom graph.
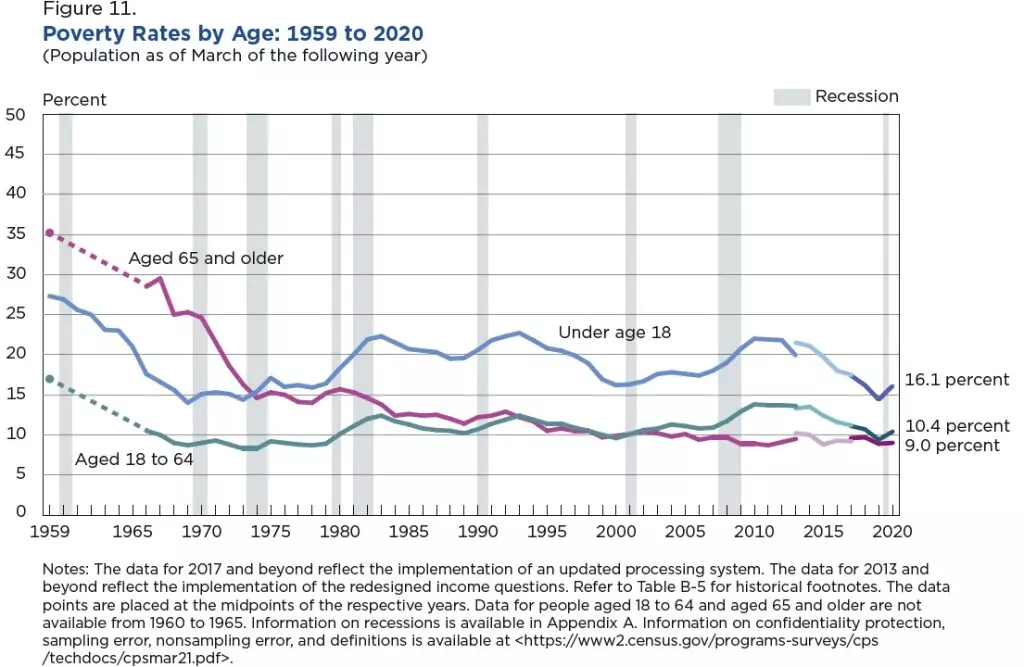
This figure shows the ongoing pattern of poverty by age: the elderly have the lowest poverty rate, and it didn’t budge much in 2020. The poverty rates for children and working-age adults both rose.
But an obvious question arises here. In an attempt to offer protection against the economic costs of the pandemic, the federal government ran a budget deficit of more than $3 trillion in 2020, equal to about 15% of GDP. How does that amount show up in these numbers? The short answer is that it doesn’t.
The poverty line is a measure of “money income.” Thus, it does include cash payments like Social Security or welfare and unemployment payments. However, it does not include a value for non-cash benefits like food stamps or Medicaid and Medicaid. It also does not include the value of payments made to the poor via tax credits, like the Earned Income Tax Credit. And what about the stimulus payments made to individuals in 2020 under the Coronavirus Aid, Relief, and Economic Security Act (CARES Act) and the Coronavirus Response and Relief Supplemental Appropriations Act (CRRSA Act)? They aren’t included in the poverty rate calculations either, because they were implemented a tax credits
There’s one really good reason not to adjust the poverty line for non-cash and tax credit support, which is that it’s always been done this way. Thus, continuing to do it in the same way allows poverty rates from one year to be compared easily to rates from the past–if what was included in the poverty rate changed each year, then such comparisons would be harder.
However, there are also obvious reasons to use a more inclusive measure of income to take a clearer picture of poverty. Thus, about a decade ago the Census Bureau developed the “Supplemental Poverty Measure,” and along with the poverty rate report, it also published The Supplemental Poverty Rate, 2020, by Liana Fox and Kalee Burns (September 2021). As this figure from the report shows, the “supplemental poverty rate” fell even though the official poverty rate rose.
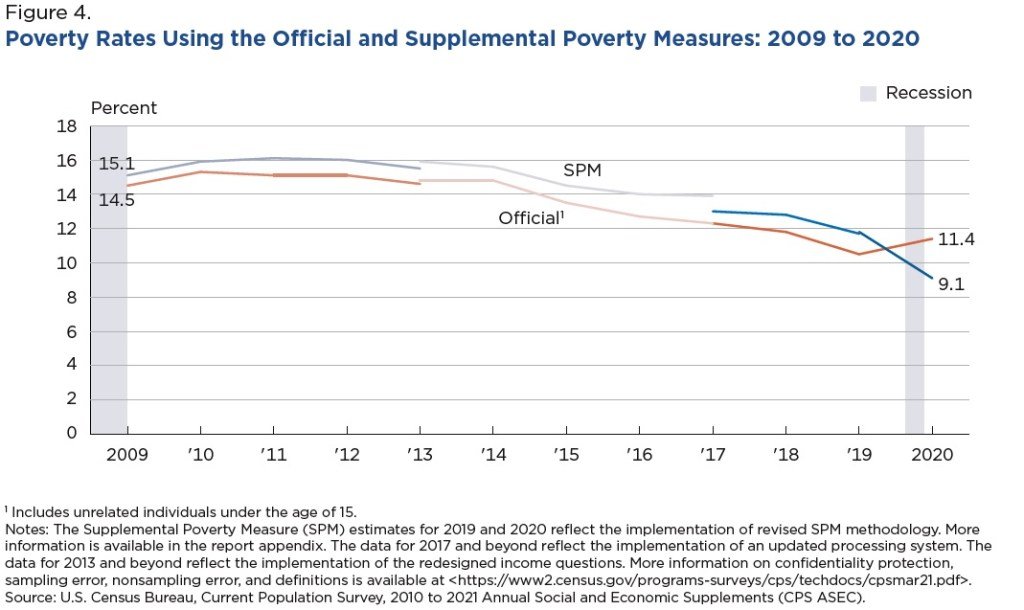
The difference is because of what is included in the two measures. As the report notes:
Income used for estimating the official poverty measure includes cash benefits from the government(e.g., Social Security, unemployment insurance benefits, public assistance benefits, and workers’ compensation benefits), but does not take into account taxes or noncash benefits aimed at improving the economic situation of the population. The SPM [supplemental poverty measure] incorporates all of these elements, adding cash benefits, noncash transfers, and stimulus payments, while subtracting necessary expenses such as taxes, medical expenses, and expenses related to work.
According to this report, the economic impact/stimulus payments reduced the number of people who would otherwise have fallen below the poverty line by 11.7 million. At least by this measure, the poor as a group did not suffer disproportionate economic losses in 2020 during the pandemic recession and its aftermath.
Timothy Taylor is an American economist. He is managing editor of the Journal of Economic Perspectives, a quarterly academic journal produced at Macalester College and published by the American Economic Association. Taylor received his Bachelor of Arts degree from Haverford College and a master's degree in economics from Stanford University. At Stanford, he was winner of the award for excellent teaching in a large class (more than 30 students) given by the Associated Students of Stanford University. At Minnesota, he was named a Distinguished Lecturer by the Department of Economics and voted Teacher of the Year by the master's degree students at the Hubert H. Humphrey Institute of Public Affairs. Taylor has been a guest speaker for groups of teachers of high school economics, visiting diplomats from eastern Europe, talk-radio shows, and community groups. From 1989 to 1997, Professor Taylor wrote an economics opinion column for the San Jose Mercury-News. He has published multiple lectures on economics through The Teaching Company. With Rudolph Penner and Isabel Sawhill, he is co-author of Updating America's Social Contract (2000), whose first chapter provided an early radical centrist perspective, "An Agenda for the Radical Middle". Taylor is also the author of The Instant Economist: Everything You Need to Know About How the Economy Works, published by the Penguin Group in 2012. The fourth edition of Taylor's Principles of Economics textbook was published by Textbook Media in 2017.
BBN Times connects decision makers to you. Experts in their fields, worth listening to, are the ones who write our articles. We believe these are the real commentators of the future. We quickly and accurately deliver serious information around the world. BBN Times provides its readers human expertise to find trusted answers by providing a platform and a voice to anyone willing to know more about the latest trends. Stay tuned, the revolution has begun.
Leave your comments
Post comment as a guest