Comments
- No comments found
The Credit Suisse Research Institute has published Global Wealth Report 2021, its annual report looking at levels and distribution of wealth around the world (June 2021).
Here are a few snapshots and comments from the report.
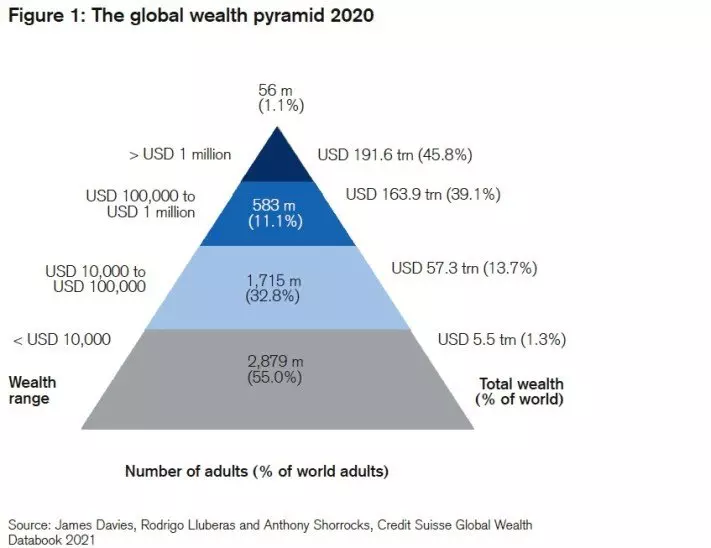
This figure shows the wealth pyramid. As the report notes, “Our calculations suggest, for example, that a person needed net assets of just USD 7,552 to be among the wealthiest half of world citizens at end-2020. However, USD 129,624 was required to be a member of the top 10% of global wealth holders, and USD 1,055,337 to belong to the top 1%.”
Here’s a summary of the wealth pyramid from the report:
We estimate that 2.9 billion individuals – 55% of all adults in the world – had wealth below USD 10,000 in 2020. The next segment, covering those with wealth in the range of USD 10,000–100,000,has seen the biggest rise in numbers this century, more than trebling in size from 507 million in 2000 to 1.7 billion in mid-2020. This reflects the growing prosperity of emerging economies, especially China, and the expansion of the middle class in the developing world. The average wealth of this group is USD 33,414, slightly less than half the level of average wealth worldwide. Total assets amounting to USD 57.3 trillion provide this segment with considerable economic leverage. …
The upper-middle segment, with wealth ranging from USD 100,000 to USD 1 million, has also expanded significantly this century, from 208 million to 583 million. They currently own net assets totaling USD 163.9 trillion or 39.1% of global wealth, which is nearly four times their share of the adult population. The middle class in developed nations typically belong to this group. Above them, the top tier of high net worth (HNW) individuals (i.e. USD millionaires) remains relatively small in size, but has expanded rapidly in recent years. It now numbers 56 million, or 1.1% of all adults. … HNW adults are increasingly dominant in terms of total wealth ownership and their share of global wealth. The aggregate wealth of HNW adults has grown nearly four-fold from USD 41.5 trillion in 2000 to USD 191.6 trillion in 2020, and their share of global wealth has risen from 35% to 46% over the same period.
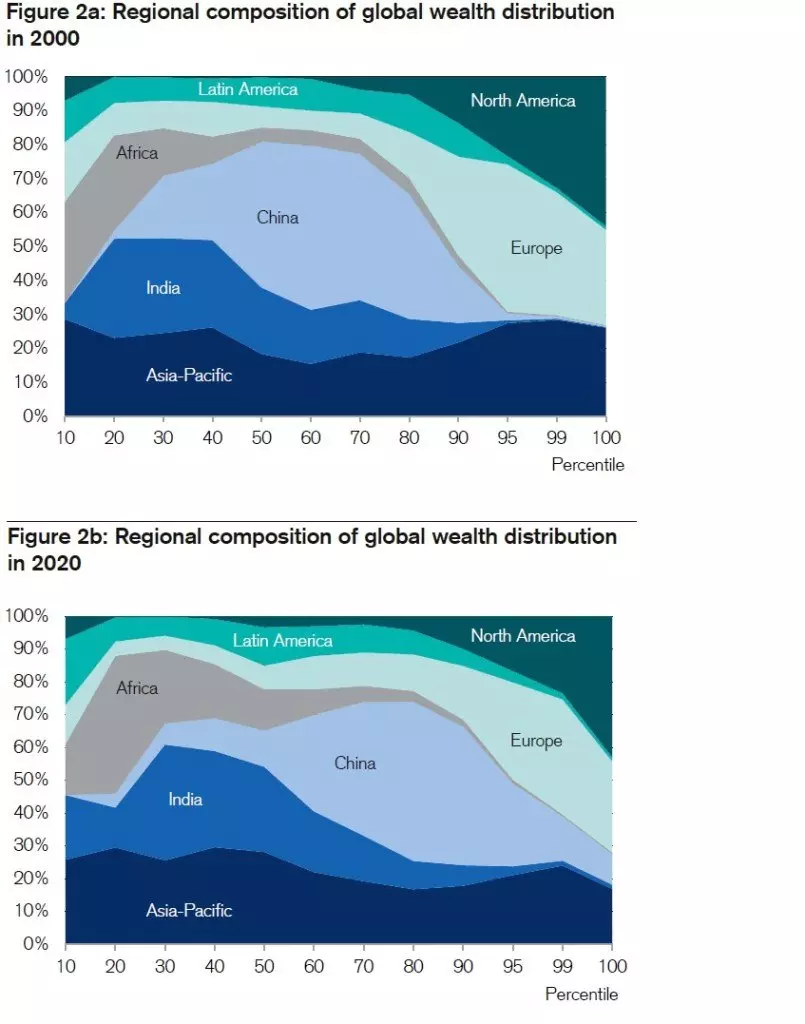
What about if we look by region? This next figure is perhaps a little harder to think about, The horizontal axis shows the percentile in the global wealth distribution. The vertical axis shows the location of people in each region in that wealth distribution. The top panel shows the data for 2000; the second panel shows data for 2020, so you can see the shift. For example, back in 2000 the bulk of China’s population was in the 40th-80th percentiles of the global wealth distribution By 2020, China has much larger share in the 60th-95th percentiles.
Finally, here’s some data by country, in a way that also shows some some interesting patterns and some reasons to be cautious about the data. This table shows the share of people in a given country who are millionaires. Remember, this is a measure of millionaires by wealth, not income. Wealth includes, for example, the savings accumulated in a retirement account and the equity in your home. Thus, this table does not say that 8.8% of Americans have $1 million in income last year. It says that when you add up retirements accounts, real estate equity, and other financial assets, 8.8% of Americans have more than $1 million in wealth. Presumably a disproportionate number of the people in this group are retired, and would have much less than $1 million in annual income.
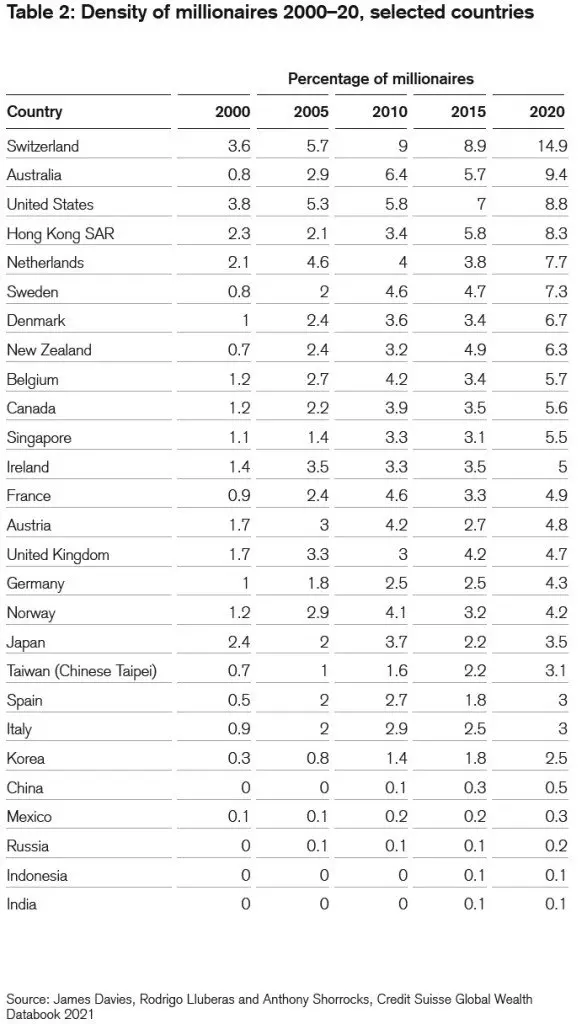
Two points about the table are worth noting. First , I found it interesting–given how many people I run into who profess to like the income distribution patterns of northern European countries like–to see that Sweden and Denmark are much higher on millionaires per capita than, say, Canada, France, Germany, and the United Kingdom. But as a second point, the numbers in this table all measure millionaires as measured in US dollars, and thus require using an exchange rate to convert from the local currency to US dollars. As a result, shifts in the number of millionaires can easily reflect shifts in the US dollar exchange rate, rather than shifts in local currency.
Timothy Taylor is an American economist. He is managing editor of the Journal of Economic Perspectives, a quarterly academic journal produced at Macalester College and published by the American Economic Association. Taylor received his Bachelor of Arts degree from Haverford College and a master's degree in economics from Stanford University. At Stanford, he was winner of the award for excellent teaching in a large class (more than 30 students) given by the Associated Students of Stanford University. At Minnesota, he was named a Distinguished Lecturer by the Department of Economics and voted Teacher of the Year by the master's degree students at the Hubert H. Humphrey Institute of Public Affairs. Taylor has been a guest speaker for groups of teachers of high school economics, visiting diplomats from eastern Europe, talk-radio shows, and community groups. From 1989 to 1997, Professor Taylor wrote an economics opinion column for the San Jose Mercury-News. He has published multiple lectures on economics through The Teaching Company. With Rudolph Penner and Isabel Sawhill, he is co-author of Updating America's Social Contract (2000), whose first chapter provided an early radical centrist perspective, "An Agenda for the Radical Middle". Taylor is also the author of The Instant Economist: Everything You Need to Know About How the Economy Works, published by the Penguin Group in 2012. The fourth edition of Taylor's Principles of Economics textbook was published by Textbook Media in 2017.
BBN Times connects decision makers to you. Experts in their fields, worth listening to, are the ones who write our articles. We believe these are the real commentators of the future. We quickly and accurately deliver serious information around the world. BBN Times provides its readers human expertise to find trusted answers by providing a platform and a voice to anyone willing to know more about the latest trends. Stay tuned, the revolution has begun.
Leave your comments
Post comment as a guest