Comments
- No comments found

Every year since 1952, the BP Statistical Review of World Energy provides a volume full of tables and charts about energy usage around the world.
What are some patterns that emerge from the just-released 2021 report? Here’s an overview comment from the introduction by chief executive officer Bernard Looney:
Global energy demand is estimated to have fallen by 4.5% in 2020. This is the largest recession since the end of World War II, driven by an unprecedented collapse in oil demand, as the imposition of lockdowns around the world decimated transport-related demand. The drop in oil consumption accounted for around three-quarters of the total decline in energy demand. … The fall in carbon emissions from energy use was equally striking, with emissions falling by over 6% in 2020 – again, the largest decline since 1945. Although unmatched in modern peacetime, the rate of decline in carbon emissions last year is similar to what the world needs to average each year for the next 30 years to be on track to meet the aims of the Paris Agreement.
That last sentence is worth some consideration. It’s easy for international conferences and countries and states and cities to make promises about future reductions in carbon emissions, and in particular to announce with fanfare goals for net-zero carbon emissions that are two or three decades in the future. But achieving those goals would require the immediate embrace of dramatic and ongoing changes in a way that would last for several decades, which in all honesty, just isn’t actually happening anywhere.
Here’s a figure showing sources of “primary energy” for the world as a whole. This includes all commercially traded sources of energy: that is, it’s a broad meausure that includes transportation, commercial and industry use, and homes.
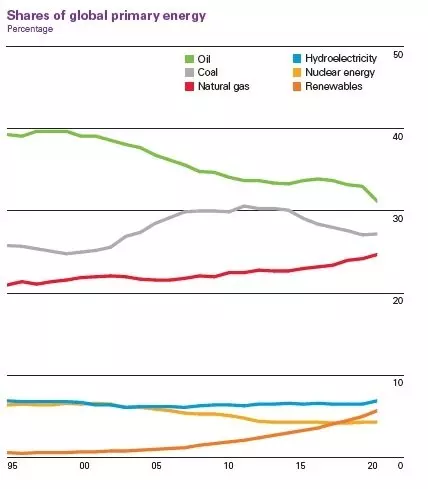
As the report summarizes this figure: “Oil continues to hold the largest share of the energy mix (31.2%). Coal is the second largest fuel in 2020, accounting for 27.2% of total primary energy consumption, a slight increase from 27.1% in the previous year. The share of both natural gas and renewables rose to record highs of 24.7% and 5.7% respectively. Renewables has now overtaken nuclear which makes up only 4.3% of the energy mix. Hydro’s share of energy increased by 0.4 percentage points last year to 6.9%, the first increase since 2014.”
I’d put it another way: there are three big energy sources each with about 25-30% of the global market, and they are all fossil fuels: oil, coal, and natural gas. There are three much smaller energy sources, all carbon-free but each with well under than 10% of the global market: hydroelectricity, nuclear, and renewables (like solar, wind, and geothermal).
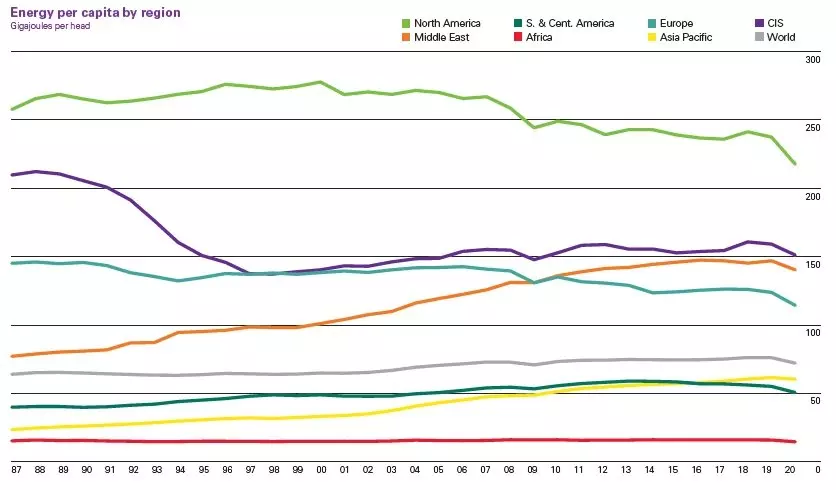
Energy use around the world is highly unequal, and as lower- and middle-income countries develop it seems virtually certain that their demand for energy will rise. Here’s a figure showing energy consumption per capita by region of the world. For the world as a whole (gray line), energy use is 71 gigajoules per person. For North America, it’s about three times as much; for Europe, the Middle East, and the Commonwealth of Independent States (mainly Russia) it’s twice as much. Other regions are still below the global average.
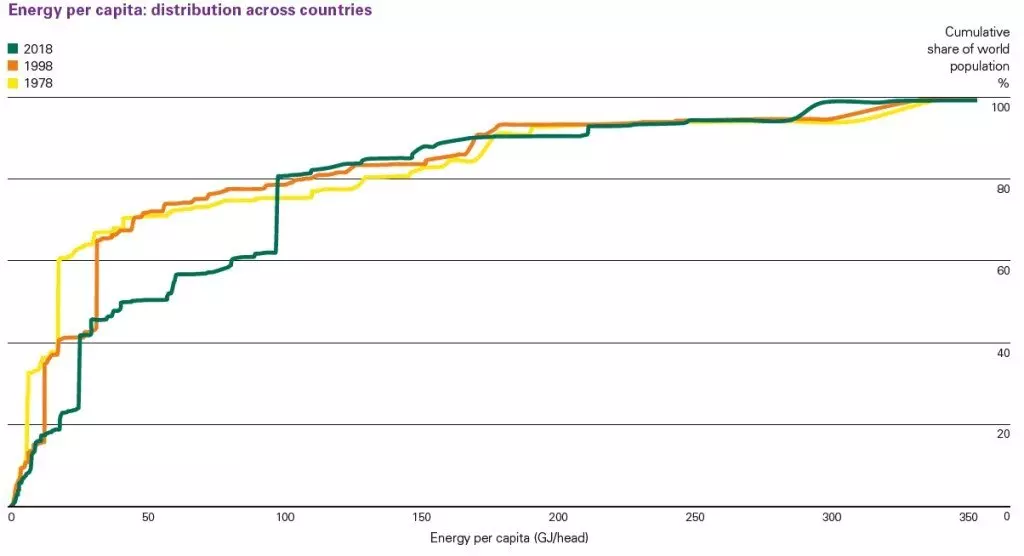
This figure shows the distribution of energy use per capita across countries. It’s a cumulative distribution: thus, the green line for 2018 is lower at the bottom left of the figure and higher at the top right, showing that a smaller share of the world population is in countries with very low energy consumption. The big vertical jump in the middle of the green line is the population of China. As the report notes: “In 2020 63.7% of the global population lived in countries where average energy demand per capita was less than 100 GJ/head, a significant decrease from 81% in 2019, as energy demand per capita in China increased to 101 GJ/head from 99 GJ/head in 2019.” As the figure shows, about 80% of the global population consumes 100 gigajoules per person or less, while the top few percent of the global population consume three times that much energy.
In terms of global carbon emissions, about one-third of all the emissions are from high-income countries, and two-thirds from low-income countries. Here’s a table that I condenses from a larger table in the report. The US accounts for 13.8% of global carbon emissions, and total US carbon emissions have been falling 0.5% per year for the decade up to 2019, with a bigger fall during the pandemic. Carbon emissions for Europe are similar, although they have been declining about twice as fast. However, the Asia/Pacific region accounts for more than half of all global carbon emissions, and before the pandemic carbon emissions from this region were growing at 2.6% per year over the decade up to 2019. China alone is 30.7% of global carbon emissions.
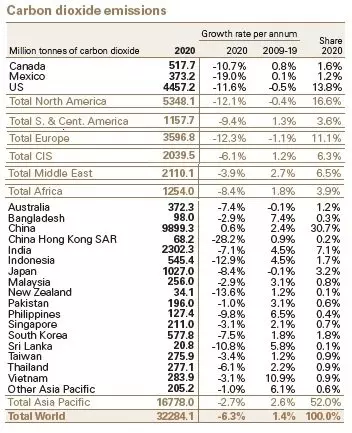
In short, no plan for reducing global carbon emissions can be considered serious if it doesn’t have a heavy focus on the Asia/Pacific region and on China. Moreover, any such plan can’t just replace existing sources of energy, but also needs to show how total energy consumption can rise dramatically–for this region and in other low-income countries around the world–while still putting carbon emissions on a downward trajectory.
Timothy Taylor is an American economist. He is managing editor of the Journal of Economic Perspectives, a quarterly academic journal produced at Macalester College and published by the American Economic Association. Taylor received his Bachelor of Arts degree from Haverford College and a master's degree in economics from Stanford University. At Stanford, he was winner of the award for excellent teaching in a large class (more than 30 students) given by the Associated Students of Stanford University. At Minnesota, he was named a Distinguished Lecturer by the Department of Economics and voted Teacher of the Year by the master's degree students at the Hubert H. Humphrey Institute of Public Affairs. Taylor has been a guest speaker for groups of teachers of high school economics, visiting diplomats from eastern Europe, talk-radio shows, and community groups. From 1989 to 1997, Professor Taylor wrote an economics opinion column for the San Jose Mercury-News. He has published multiple lectures on economics through The Teaching Company. With Rudolph Penner and Isabel Sawhill, he is co-author of Updating America's Social Contract (2000), whose first chapter provided an early radical centrist perspective, "An Agenda for the Radical Middle". Taylor is also the author of The Instant Economist: Everything You Need to Know About How the Economy Works, published by the Penguin Group in 2012. The fourth edition of Taylor's Principles of Economics textbook was published by Textbook Media in 2017.
BBN Times connects decision makers to you. Experts in their fields, worth listening to, are the ones who write our articles. We believe these are the real commentators of the future. We quickly and accurately deliver serious information around the world. BBN Times provides its readers human expertise to find trusted answers by providing a platform and a voice to anyone willing to know more about the latest trends. Stay tuned, the revolution has begun.
Leave your comments
Post comment as a guest