Homeownership rates in the US rebounded a bit in 2017, but remain near historically low levels. This is a source of concern for a number of reasons: homeownership is a savings vehicle that has worked for a number of households over time; being a homeowner encourages people to look after and contribute to their neighborhoods; and homeownership is part of that loose vision of the good life sometimes called the "American dream." I'll draw on evidence presented in The State of the Nation's Housing 2018, the 30th version of an report produced annually by the Joint Center for Housing Studies of Harvard University. For those who want an overview of US housing markets, including issues of rental markets and low-income affordability, it's a good place to start. Here, I'll focus on homeownership patterns.
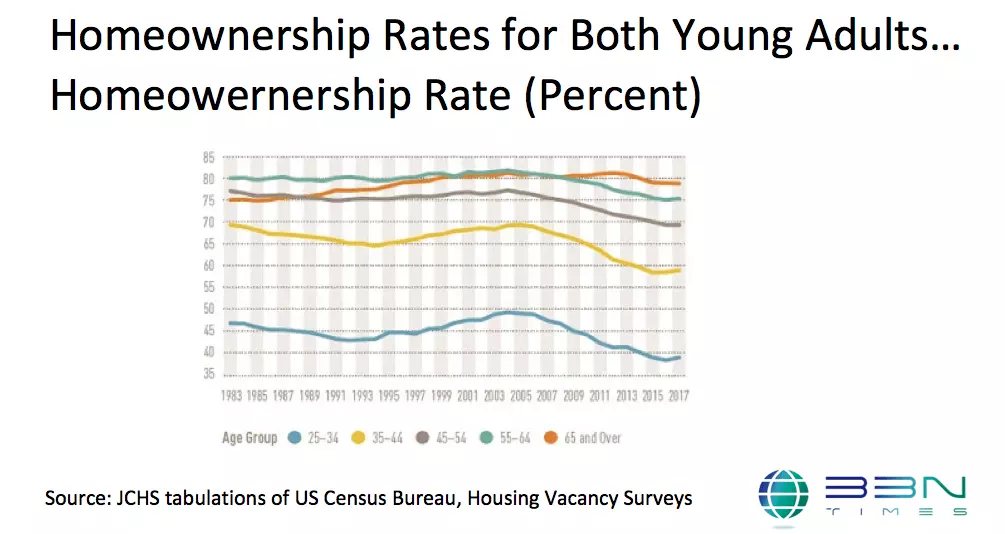
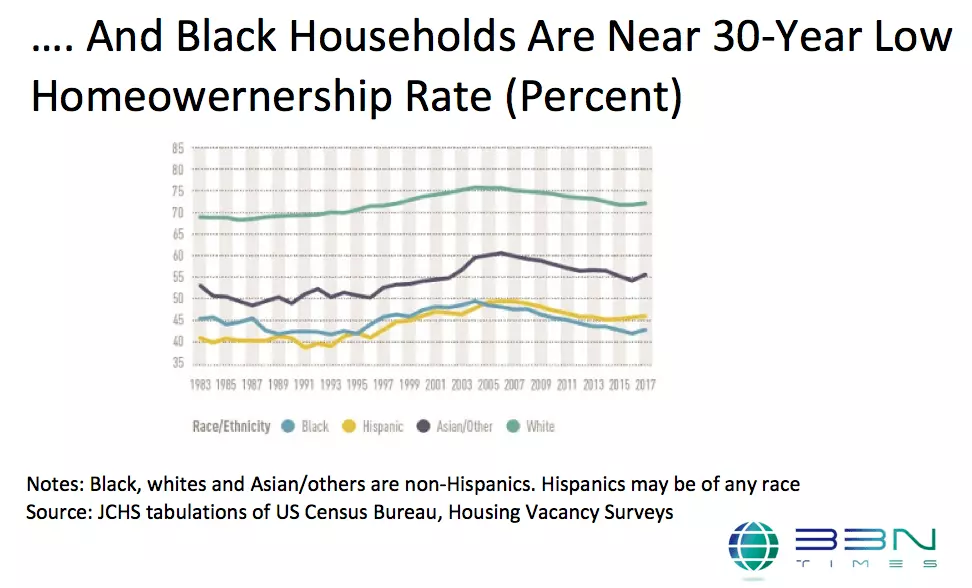
As a starting point, here are a couple of figures showing homeownership by age and by race/ethnicity. After the peak of prices in the housing market back around 2006, the rate of homeownership doesn't change too much for the over-65 age bracket--many of whom were presumably already well-settled into homeownership many years before 2006--but drops visibly for every other age group. The biggest drops are for the younger age groups. Homeownership drops for every racial/ethic group, as well. But for blacks in particular, the drop is severe enough that homeownership rates are near their low point for the last four decades.


Interest rates for mortgage borrowing are relatively low by historical standards, so that isn't the issue. Instead, the main issue seems to involve the high price for purchasing housing, and probably also some concerns about the desirability of being a homeowner having just watched the housing price decline in the lead-up to the Great Recession. The Harvard report offers some backstory:
"In 1988, when the first State of the Nation’s Housing report highlighted historically high homeownership costs, the national home price-to-income ratio was 3.2, with just one metro posting a ratio above 6.0. In 2017, the national price-to-income ratio stood at 4.2, and 22 metros had ratios above 6.0. So far, however, low interest rates have kept the median monthly payments on a modest home relatively affordable—in fact $250 lower in real terms than in 1988. However, the ongoing rise in both interest rates and home prices may change this. In addition, higher prices mean higher downpayments and closing costs, an even more difficult hurdle than monthly payments for many first-time homebuyers."
Limits on the available supply of housing seem to be keeping prices high.
"In 2017, the supply of for-sale homes averaged only 3.9 months—well below the 6 months considered a balanced market. Zillow puts supply even lower at just 3 months, with inventories in roughly a third of 93 metros under 2 months. Lower-cost homes are especially scarce. Virtually all of the 88 metros with data available had more homes for sale in the top third of the market by price than in the bottom third. In 46 of these metros,more than half of the available supply was at the high end. ...
"Why inventories are so tight is not entirely clear. CoreLogic data show that the number of owners underwater on their mortgages shrank from more than 12.1 million in 2011 to 2.5 million in 2017, so negative equity should no longer be a significant drag on sales. Still, conversion of 3.9 million single-family homes to rentals in 2006–2016 could be constraining the number of entry-level homes on the market. The ongoing decline in residential mobility rates may also play a role, with fewer households putting their homes up for sale each year.
"Another factor is the low level of single-family construction. Despite six consecutive years of increases, single-family starts stood at just 849,000 units in 2017, well below the long-run annual average of 1.1 million. Indeed, only 610,000 single-family homes were added to the stock annually in 2008–2017. Limited new construction may hold back existing home sales by reducing the tradeup options for current owners, deterring them from putting their own homes on the market.
"The slow growth in single-family construction reflects in part homebuilder caution following the dramatic housing bust. But risk aversion aside, a significant constraint on new residential construction may be the dwindling supply of buildable lots. According to Metrostudy data, the inventory of vacant lots in the 98 metro areas tracked fell 36 percent in 2008–2017. Indeed, 21 of the nation’s 25 largest metros reported inventories that would support less than 24 months of residential construction.
"Along with limited land, respondents to builder surveys cite rising input costs as adding to the difficulty of constructing entry-level homes. As a result, the share of smaller homes (under 1,800 square feet) built each year fell from 50 percent in 1988 to 36 percent in 2000 to 22 percent in 2017."
The US homeownership rate has turned up just a bit in the last year or so, after hitting a 50-year low in the second quarter of 2016. But if the US believes that a higher homeownership rate is a valuable public policy goal, the challenge seems to be to find governing rules for the housing market so that it is profitable for builders to construct a greater quantity of housing, especially at lower and moderate price ranges.


Leave your comments
Post comment as a guest