Comments (5)
Luke Giles
Ready. Set. Blow! Haha
Danny Storton
Thanks for the analysis
Craig Graham
Never go with the cheapest option
Kelly Reynolds
Great analysis
Dave Stout
Come on Bitcoin!!!

Despite the headlines that Bitcoin has received for being a highly volatile asset class, it’s not as “risky” as the bell curve would have you believe.
Every year, Timothy “Tim” Steeler would try to guess the number of jawbreakers in a jar at the county fair in the hopes of winning the US$1,000 cash prize and every year he would fail, being off by a huge margin.
And as each year passed, because nobody in town could guess the right number of jawbreakers in the jar, the prize money was snowballed till it hit US$10,000.
So when a friend of Tim’s who was mathematically inclined suggested another method of trying to figure out the number of jawbreakers in the jar, he was all ears.
One person estimating the number of jawbreakers in a jar is unlikely to be accurate, either by going to far over or too far under.
But by getting as many people as possible to take a stab at the number of jawbreakers in the jar, the answer, would come surprisingly close and on a balance of probabilities, increase the odds of being right.
The method, known as the “Wisdom of Crowds” principle, was made famous over a century ago by the famous British scientist, Sir Francis Galton, when applied to estimation contests.
In that experiment, at a cattle market, visitors could estimate the slaughter weight of an exhibited ox. Galton examined those estimates and found that the average estimate differed little from the actual figure.
The principle that averaging multiple estimates provides a relatively accurate outcome — often better than most underlying estimates and sometimes even better than all — eventually came to be known as the “Wisdom of Crowds.”
With that knowledge in mind, Tim, stood in front of the jar of jawbreakers and listened as one after another, townsfolk came to give their guess for the number of jawbreakers in the jar.
The more guesses he listened to, the more accurate his average became. Finally, when it was time to close the contest for the night and when the country fair’s organizers prepared to again announce that no one had gotten the answer right, Tim stepped forward to present his answer — one thousand, four hundred and forty-seven.
The county fair officials stood slack-jawed. Tim was wrong, but he was only off by a single jawbreaker.
As a consolation, they gave him a US$500 prize and the jar of jawbreakers to keep as a souvenir — next year’s county fair contest would feature a larger jar of jelly worms.
There are plenty of things in life, where estimating averages provides a good enough portrait of the situation and often that’s all that’s needed.
For instance, imagine you had to bet on the height of the next man to walk into the coffee shop you are sitting in. A good guess would be 5' 9" — which also happens to be the average height of an adult male in America.
If you had guessed 5' 9" the odds are you’d be wrong, but not by a whole lot. The bulk of the men who would walk into that coffee shop would be close to the average height — very few would be an inch or two below or above it and only a tiny percentage would be a whole lot shorter or taller. 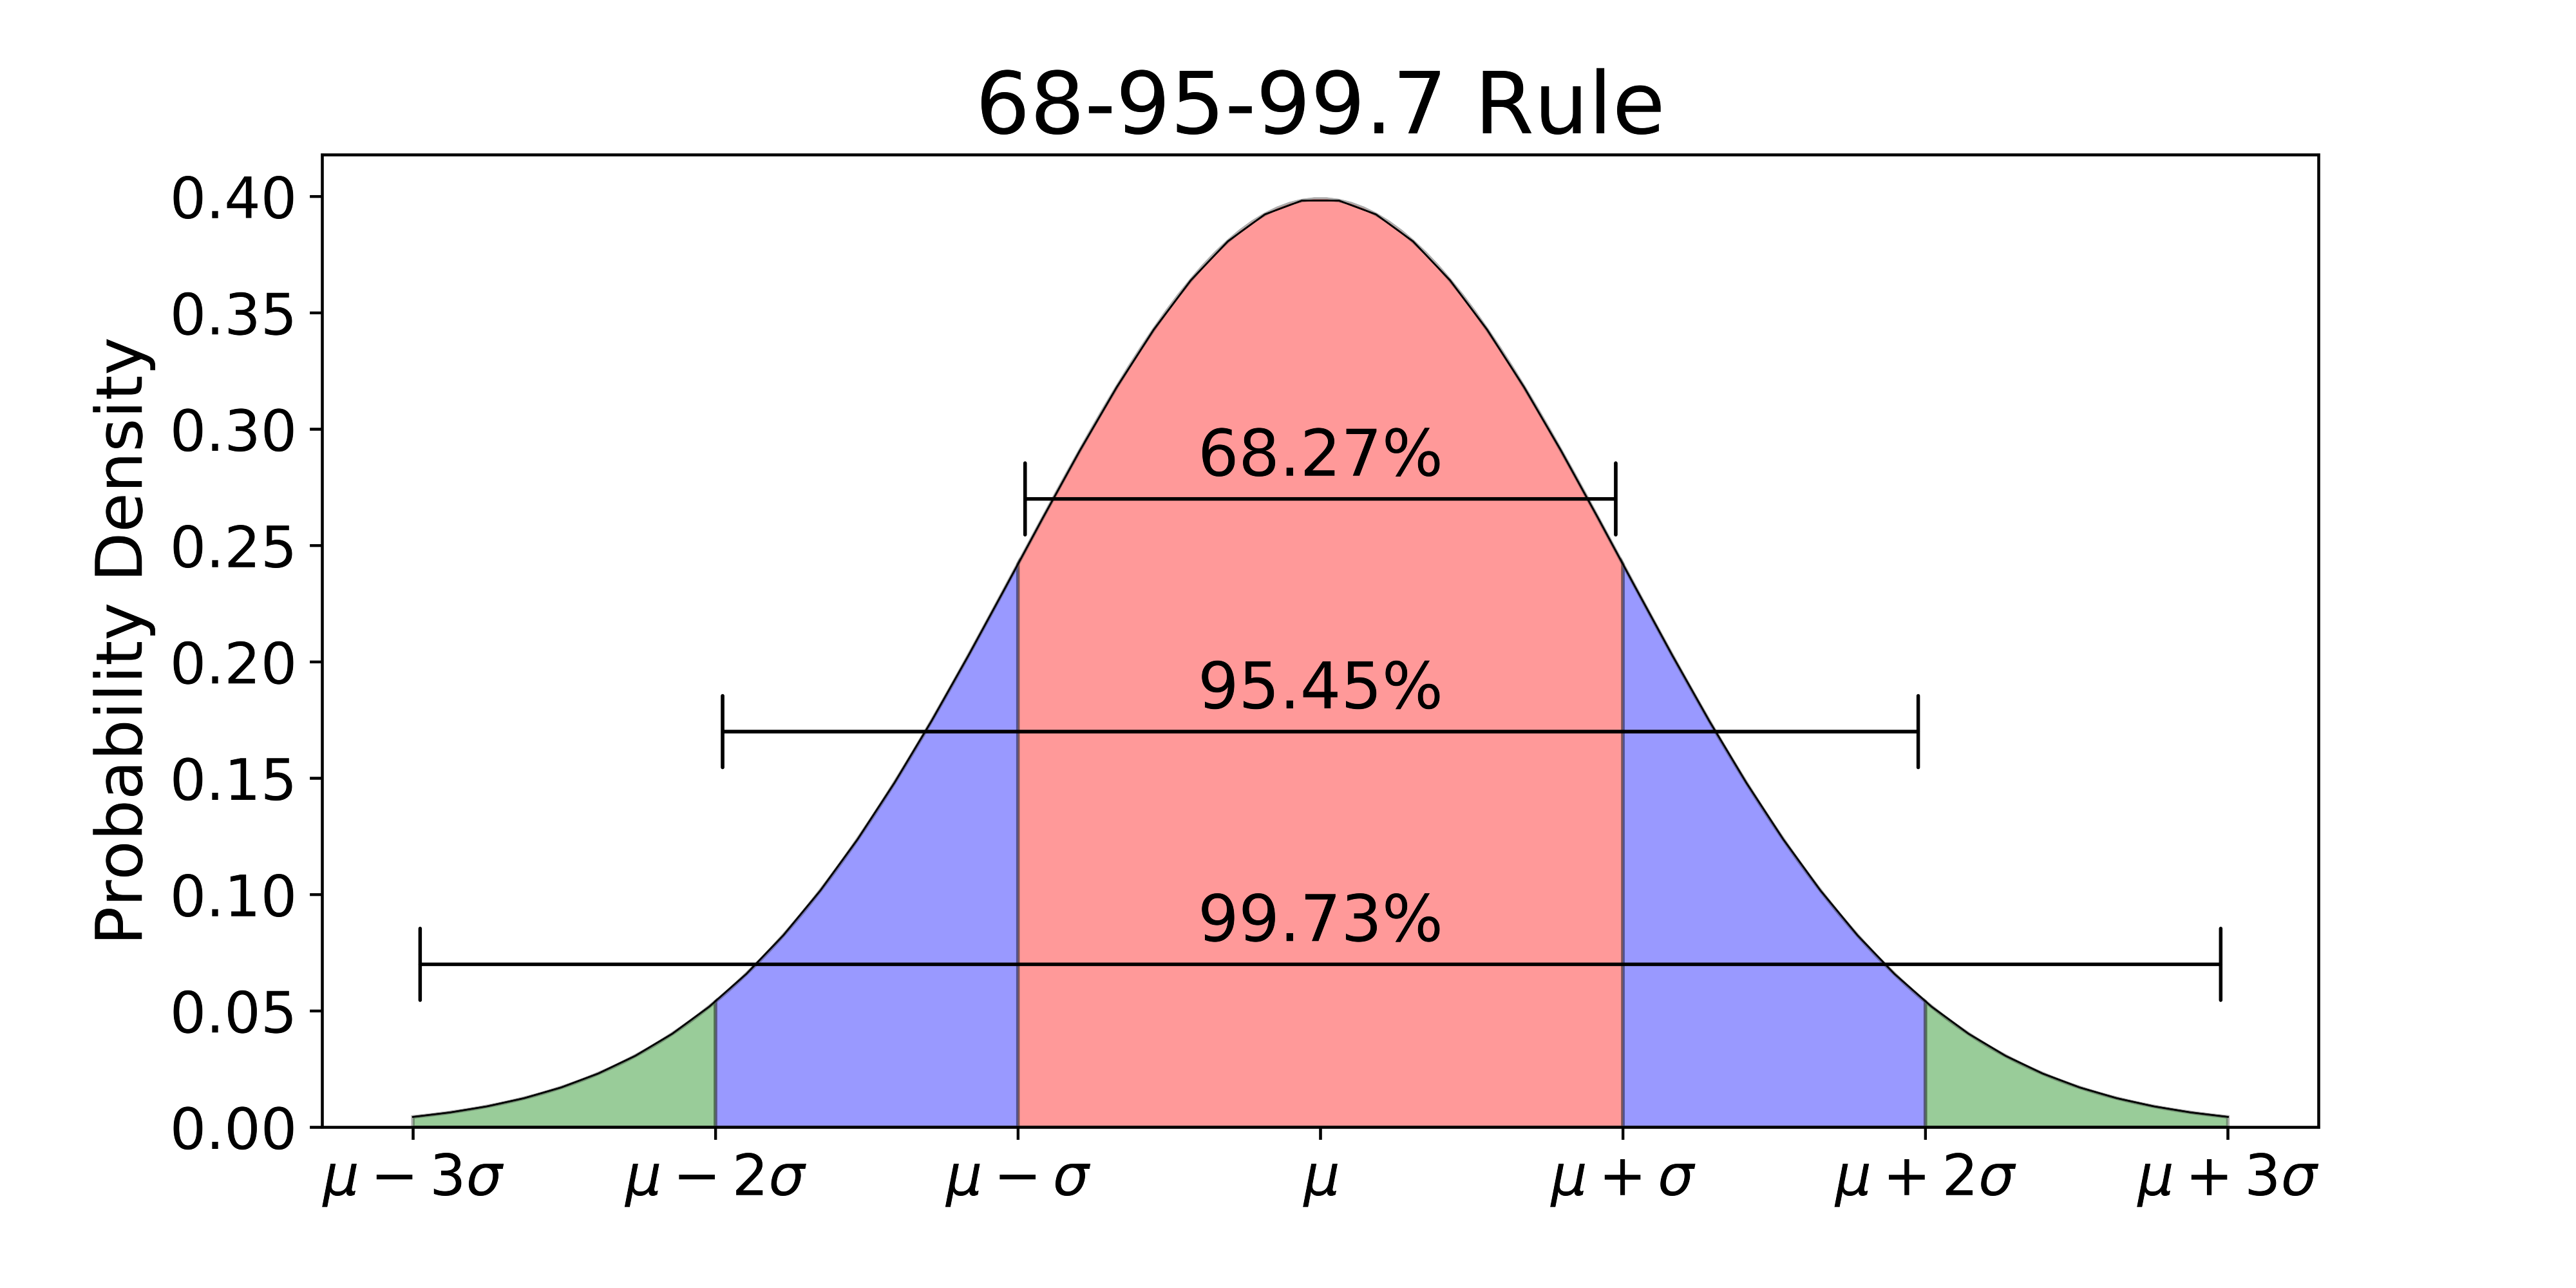
68% of the data is within 1 standard deviation, 95% is within 2 standard deviation, 99.7% is within 3 standard deviations — in other words, a normal distribution. It’s why people don’t generally grow to the sky or to the ground.
A random throw of two dice is similar — there are 36 possible pairs of numbers.
Some throws are mathematically more likely than others — there are six ways to throw a total of 7, but only 1 one way to throw a total of 2 or 12.
If you were to plot each possible throw by how often it occurs, it would follow the outline of a typical bell curve — also known as a normal distribution.
And it’s not just dice and height, there are plenty of other measures — IQ, exam scores — which also look like bell curves when plotted on a graph.
A feature of normal distribution is that the values deviate from the average in an ordered and therefore, somewhat predictable way.
Two-thirds of dice throws (24 out of 36) are within one standard deviation of the average throw (within a normal range of 5 to 9).
In a normal distribution, 68% of outcomes are within one standard deviation of the average and a staggering 95% are within two.
In such circumstances, the average is a good predictor of how something entirely “random” will turn out.
And while averages work well when you’re trying to guess the number of jawbreakers in a jar, height or IQ, for other things, the average lies on shaky ground — these are markets for instance where there are so-called “fat tails” as opposed to the more typical bell curve of averages — in which values are more widely spread on the chart and the bell curve is less pronounced. 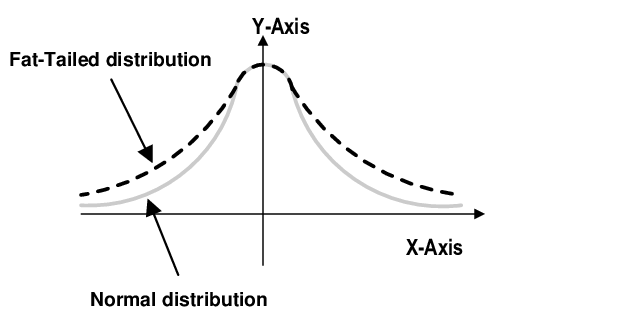
In such a “fat-tailed” world, having options, the right to buy or sell assets at a predetermined price, is extremely valuable and the action that matters most is not in the middle, but on the fringes — the so-called “fat tails.”
And it’s the fat tails where Bitcoin really gets its bad rap.
The standard deviation — a measure of volatility — is a key concept for options trading.
And for a typical measure a market such as the S&P500, the VIX or volatility index, is the most widely used gauge for volatility in general.
Key inputs to the value of an S&P500 option include expected volatility and the gap between the “strike” price (the price at which an option can be exercised to either buy or sell) and the actual index price — sometimes referred to as the “premium” or “spread.”
In general, the more volatile prices are, the larger the gap between the strike price of the option and the current price of the index. 
For instance, if the VIX says that implied volatility is 14, it means that traders expect an annual standard deviation of 14% in stock prices.
But just because traders expect or imply volatility to be at a certain level doesn’t mean that it will be — it depends in large part on the weight of buyers and sellers.
Volatility “sellers” are in effect supplying insurance — because they are betting on the middle — a normal distribution — that the world will stay regular and normal and increasingly trend towards that — which in the case of the S&P500 is not as risky a bet as one would think.
Consider that between April 1, 2013 and January 1 2018, Bitcoin experienced no less than 20 corrections that saw its price fall by at least 22%, including four corrections which exceeded 50% in just 5 years.
In contrast, the S&P500 only saw three corrections exceeding 50% over the last 90 years.
And even if you consider that Bitcoin trades 24/7, that still means that Bitcoin saw a correction in excess of 50% no less than 4 times in at least the last 15 years, compared with 3 for the S&P500 over nine decades.
Because markets can be viewed from the lens of competing narratives that are a manifestation of the human emotions of fear and greed, we naturally expect them to be fat-tailed.
Yet a histogram for the S&P500’s daily returns for 2018, shows a much closer to normal distribution — like a dice roll.
Maybe God really does play dice with the market. 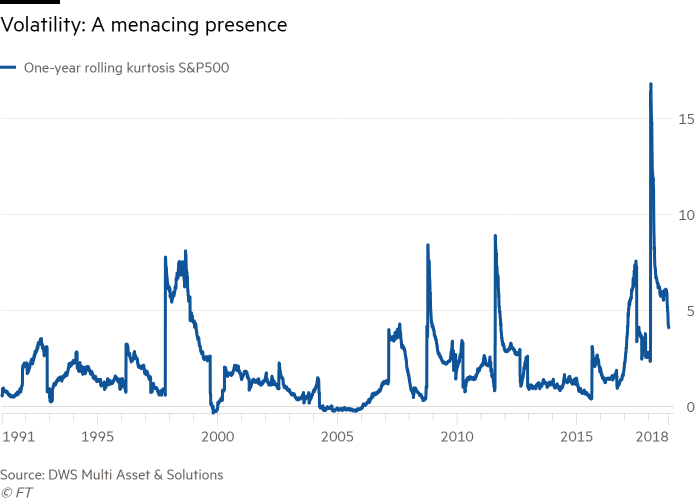
Just as there will be days when the daily returns of the S&P500 will fall well outside a normal distribution curve, this really doesn’t happen all that often. For the 250 observations of daily returns of the S&P500 in 2018, only 6 fell outside of the normal distribution curve.
In contrast, in 2017, which was before Bitcoin’s dramatic fall, of the 364 daily observations of daily returns for Bitcoin, 28 fell outside of the normal distribution curve — Bitcoin is expectedly far more volatile than the S&P500.
So it should come as no surprise that Bitcoin is far more volatile than the S&P500, but volatility does not equate to risk.
One of the reasons is that the S&P500 is a long established instrument, with no shortage of derivatives such as futures and options, providing a looking glass into where traders think the market will go in the future.
And remember, the more traders take a view, the more likely that view will be within a normal distribution.
Bitcoin on the other hand is a relatively juvenile asset class and represents a far more emotion and sentiment driven investment class.
Which is why when the Chicago Mercantile Exchange (CME) and the Chicago Board Options Trading (CBoE) launched their cash-settled Bitcoin futures contracts towards the tail end of 2017, Bitcoin’s price crashed shortly thereafter.
Because prior to the arrival of these futures contracts, there was only one real way to bet on Bitcoin — up.
To be sure, some were betting on Bitcoin to fall, but given the dearth of options and other derivatives to trade in Bitcoin, there was little opportunity to do so.
Not so when CME and CBoE launched their Bitcoin futures — suddenly the sell pressure for Bitcoin found an outlet.
Fast forward to 2019 and things have changed significantly for Bitcoin and its derivatives.
The Intercontinental Exchange’s Bakkt physically-settled Bitcoin futures means that now traders can bet on Bitcoin in both directions — but with physical settlement — a big difference when you consider that the CME and CBoE products did little to affect the underlying demand for Bitcoin. 
And because volatility sellers are supplying insurance and volatility buyers are buying insurance — this created the tension we now witness in Bitcoin prices.
Volatility buyers don’t believe in the middle of the bell curve — they assume an inherently disordered world and sometimes they are right.
Because asset prices involve valuation, a fundamentally subjective and innately human expression, prices are not distributed or ordered the way height is.
Extreme events such as market crashes are more frequent than normal distribution would typically allow for — but that has been changing as well.
Ignoring the events of the past two weeks, prior to this point in history, volatility for stock, bond and currency prices has been unnaturally low — all this despite global viruses, the rise of populism, trade wars, papal abdications, civil unrest and rising nationalism.
One of the reasons for this is that central banks have relaxed monetary policy whenever markets have panicked, suppressing volatility by introducing liquidity into the system.
But Bitcoin has no “invisible hand” to steady its course.
And with no traditional fundamental metrics for investors to come up with an “appropriate valuation” for Bitcoin, its price in dollars, reflects a constant tension between perceptions of an asset which has to date, no historical equivalent other than a tenuous comparison with gold.
With the increased availability of options and a variety of other Bitcoin derivatives, there is greater insight into what traders think the future price of Bitcoin will be, with many of these options centered into the very fattest part of the bell curve — because those are the options more likely to be “in the money.”
Because Bitcoin prices seem so random, many investors steer away from it as they assume that volatility is synonymous with risk.
But randomness shouldn’t be worrisome and in fact, random price movements can be good.
For investors, what should matter more in the words of Eugene Fama,
“If transactions are fairly uniformly spread across time, and if the number of transactions per day, week, or month is very large, then the Central Limit Theorem leads us to expect that these price changes will have normal or Gaussian distributions.”
Which in many ways perfectly describes Bitcoin transactions — their numbers are large, manipulated or not is less relevant, but you need large numbers for accurate predictions. 
Because just like our jar of jawbreakers, while it may be difficult to pinpoint the exact price of Bitcoin at any one point in time, it is possible to come relatively close within a range — and for options pricing — that’s all we really need to do.
When an asset’s returns are normally distributed, the probabilities of those returns can be known and knowing these probabilities can give investors a reliable framework to account for the risk of holding such an asset — in this case Bitcoin.
What we then have is the “Wisdom of Crowds” for which there are several factors that act in Bitcoin’s favor.
Because more and more Bitcoin derivative products are being made available, both on unregulated and regulated exchanges, it becomes possible to gather data on the fattest parts of the curve.
And even though much of Bitcoin trading (even for derivatives) can and is manipulated, the regularity and volumes of that manipulation can be catered for in calculating the fattest part of the curve. 
The key then is not so much to try and predict the actual price of Bitcoin, but try to ball park the range where it will be, within various timeframes, from seconds, to hours, to minutes, days, weeks and months.
Just like a batter only takes a swing when a pitcher places the ball within a zone where the batter has the best statistical probability of making contact, Bitcoin options trading strategies can be deployed so as to only load up on options when trading in those options falls within the same sweet spot where the vast majority of those options are likely to be “in the money.”
The problem with the common interpretation of risk is that it focuses simply on volatility, assuming that the more volatile an asset is, the more risk.
However, such an approach ignores the nature of volatility and lumps even normally distributed returns that have “fat tails” into the “risky category.”
But if returns are normally distributed — and that’s what really matters, then no matter how fat these tails are, the probabilities for those returns are knowable.
For instance, imagine an asset where the tails of the normally distributed returns reach -50% and 50%. Such an asset would be by considered very volatile and by conventional interpretations of volatility —very risky.
But if the asset follows a normal distribution, it can be known that the tails of the curve represent 2 and 3 standard deviations from the mean, while somewhere in the shoulders of the curve represents 1 standard deviation.
When that information is known, an options investment strategy can be tailored around such probabilities and even very volatile assets can be traded just like less volatile ones.
While the S&P500 in no way falls within a normal distribution curve, it does fit one more tightly than Bitcoin.
And even then, central bank intervention means that volatility in a variety of traditional financial instruments has been artificially suppressed — something that is possible because inflation remains low.
A revival of inflation will one day hamstring central bank’s ability to play God in the markets and for some option buyers, that is the day of deliverance that they have been waiting for.
But Bitcoin marches to a different tune because it is an entirely new asset class with different assumptions.
Given that it represents a plethora of differing views as to its valuation, Bitcoin options, perhaps more so than any other derivative instrument, has the potential to more closely reflect the “Wisdom of Crowds” and market psychology at its purest.
Even if you don’t guess the exact number of jawbreakers in the jar, enough guesses will get you fairly close — for Bitcoin options, that may be more than enough.

Ready. Set. Blow! Haha
Thanks for the analysis
Never go with the cheapest option
Great analysis
Come on Bitcoin!!!
Patrick is an innovative entrepreneur and a lawyer passionate about cryptocurrencies and the business world. He is the CEO of Novum Global Technologies, a cryptocurrency quantitative trading firm. He understands the business concerns of founders and business people helping them to utilise the legal framework to structure their companies to take advantage of emerging technologies such as the blockchain in order to reach greater heights. His passion for travel, marketing and brand building has led him across careers and continents. He read law at the National University of Singapore and graduated with Honors in the Upper Division and joined one of Singapore’s top law firms, Allen & Gledhill where he was called to the Singapore Bar as an Advocate & Solicitor in 2005. He created Purer Skin, a skincare and inner beauty company which melds the traditional wisdom of ancient Asian ingredients such as Bird's Nest with modern technology. In 2010, his partner and himself successfully raised $589,000 from the National Research Foundation of Singapore under the Prime Minister’s Office. He has played a key role in the growth of Purer Skin from 11 retail points in Singapore to over 755 retail points in Singapore and 2 overseas in less than a year. He taught himself graphic design, coding, website design and video editing to create the Purer Skin brand and finished his training at a leading Digital Media Company.
BBN Times connects decision makers to you. Experts in their fields, worth listening to, are the ones who write our articles. We believe these are the real commentators of the future. We quickly and accurately deliver serious information around the world. BBN Times provides its readers human expertise to find trusted answers by providing a platform and a voice to anyone willing to know more about the latest trends. Stay tuned, the revolution has begun.
Leave your comments
Post comment as a guest