Comments (4)
Martin Filimonov
I love your explanation, literally not getting bored
Jason Dakin
You are such an amazing instructor Kurt. Thanks for the different examples.
Rajesh Prasad
Amazing resource !!
Tony Diaz
Many thanks...

Network graphs play a large part in both computing and data science, and they are essential for working with (and visualizing) both semantic graphs and property graphs.
Nearly thirty years ago, AT&T produced a set of libraries called graphviz which were designed to generate various types of printed output. Over the years, the library has been adapted for different platforms and roles, and today is still one of the most widely used network graph visualization tools around.
One of the most common libraries associated with graphviz is the DOT library. DOT is a declarative language that let's users specify the components of a network graph, including the nodes (or dots) that are typically used to represent entities, along with the directed edges that are used to specify relationships or attributes. While there are other things that DOT can be used for, the language is powerful enough to create graphs with hundreds or even thousands of nodes, and serves as the foundation for other visualization libraries when moving out beyond that scale.
At its core, DOT usually specifies directed graphs, or graphs in which each edge has a specific direction of traversal. You can experiment with DOT using the GraphViz Online viewer. One of the simplest such DOT file graphs looks something like this:

The DOT file that describes this graph is about as simple:
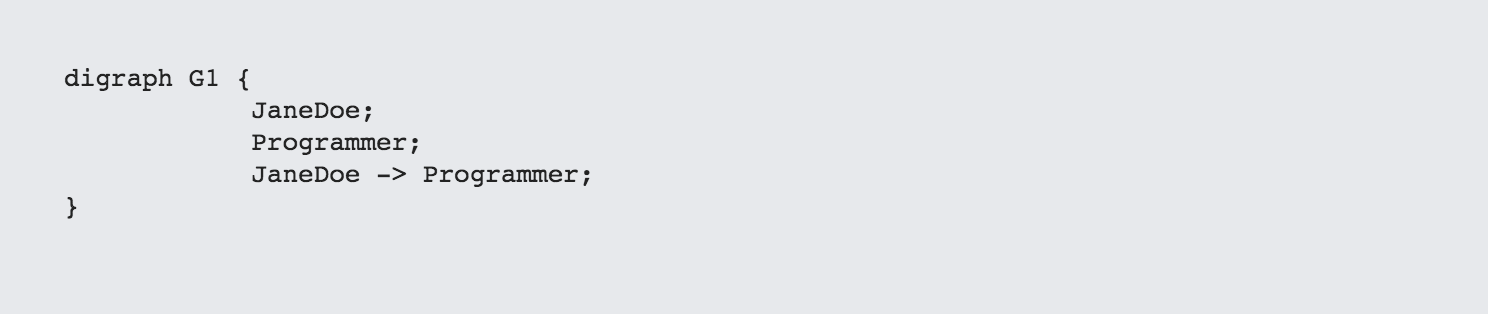
The digraph term indicates that this is a directional graph (one of a number of different kinds of graphs), with the G1 indicating the identifier of the graph. Graphs can be used within other graphs, and as such can also be named. The identifiers can either be alphanumeric sequences (along with the underscore character) or can be strings delimited with quotation marks. These identifiers serve as labels if no labels are otherwise given.
Thus, in this example, the graph identifies two nodes (JaneDoe and Programmer) and one edge (JaneDoe -> Programmer) which creates a relationship between the two indicated by an arrow terminated line from one element to another, which is indicated by a right pointing arrow.
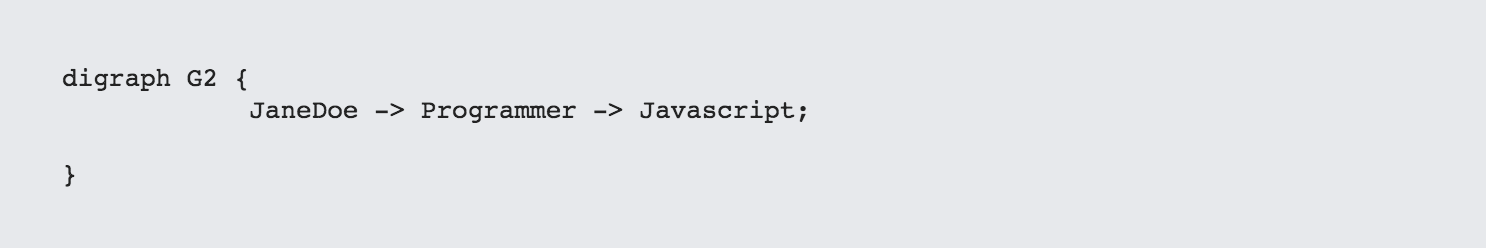
If you have a sequence such as JaneDoe -> Programmer -> Javascript, this creates a set of nodes JaneDoe, Programmer and Javascript if they don't exist already exist, with arrows between them:

For single word graphs, this is probably sufficient, but you can also "decorate" each node and edge, using attributes and labels. Suppose, for instance, that you wanted to include a class indicator with each node, and wanted some kind of relationship between each node. This where labels come in handy:
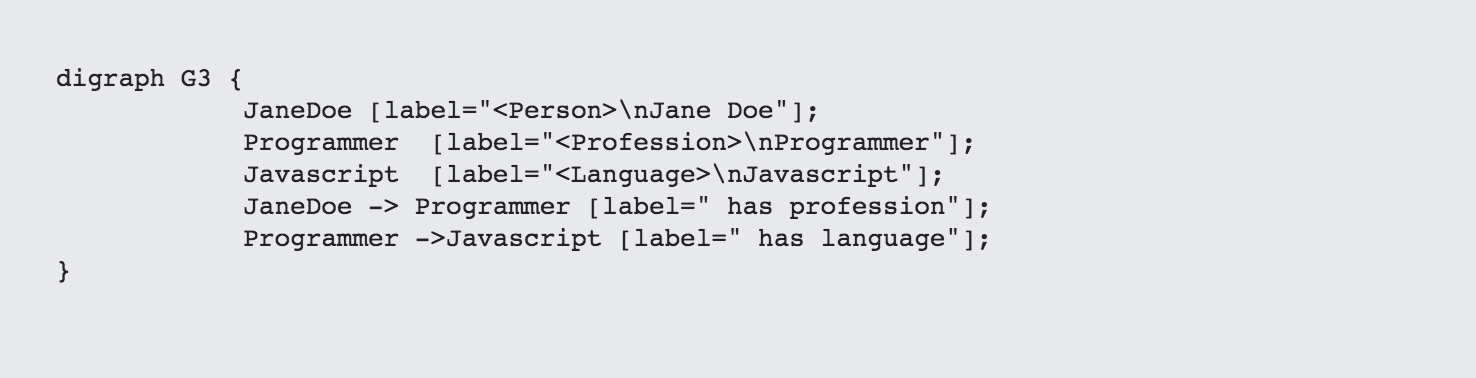

One of the great things about DOT is that you generally do not need to worry about layout, fitting text to different shapes, or managing overlap. In the example for G3, line breaks can be added in with the "\n" newline character, letting you create multiline labels. Similarly, the DOT algorithms will place the edge labels to avoid (as much as possible) overlapping with either shapes or other edges.
The attributes section (indicated by square brackets) can also include other formatting metadata. For instance, suppose that you wanted each class to have its own color, wanted the text to be in Arial (or Helvetica) and wanted the text to be white on dark color backgrounds, you can use additional DOT styles that correspond (roughly) to basic CSS.
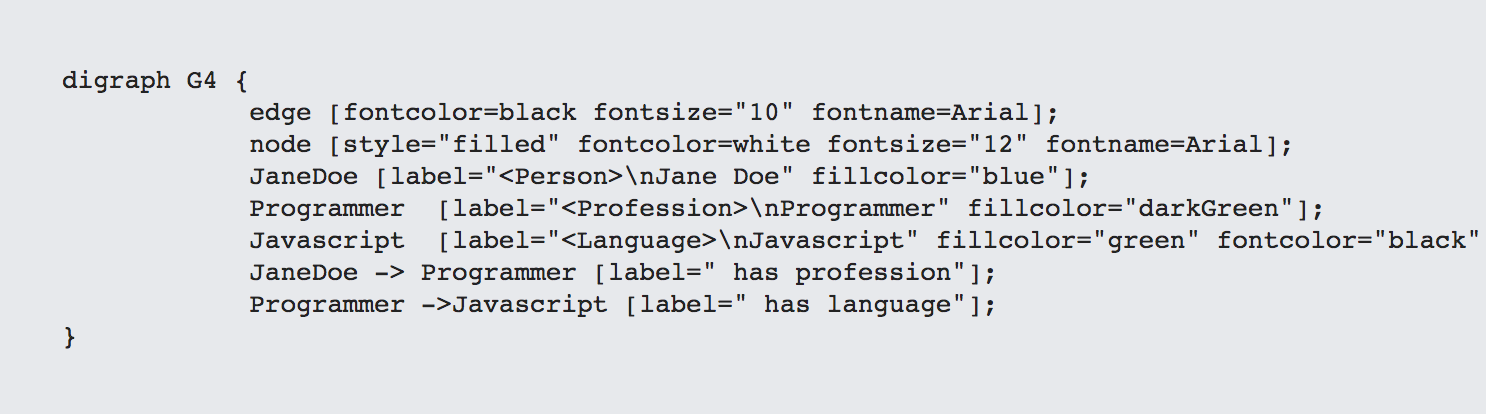

In G4, notice the use of the edge and node descriptors. These provide a way to create a common description for a node or edge that everything in the graph uses. This edge instance, for example, sets the font color (black) font size (10pt) and font name (Arial). The node sets the default color for text (white) and also indicates that the shape in question is filled. Each node entry can then override certain values (such as the font color) for Javascript being set to black because the light green is light enough that white text becomes difficult to showcase.
With DOT, you can also create subgraphs, which can both have associated traits and can serve to aggregate groups of content and apply node and edge characteristics at different scopes:
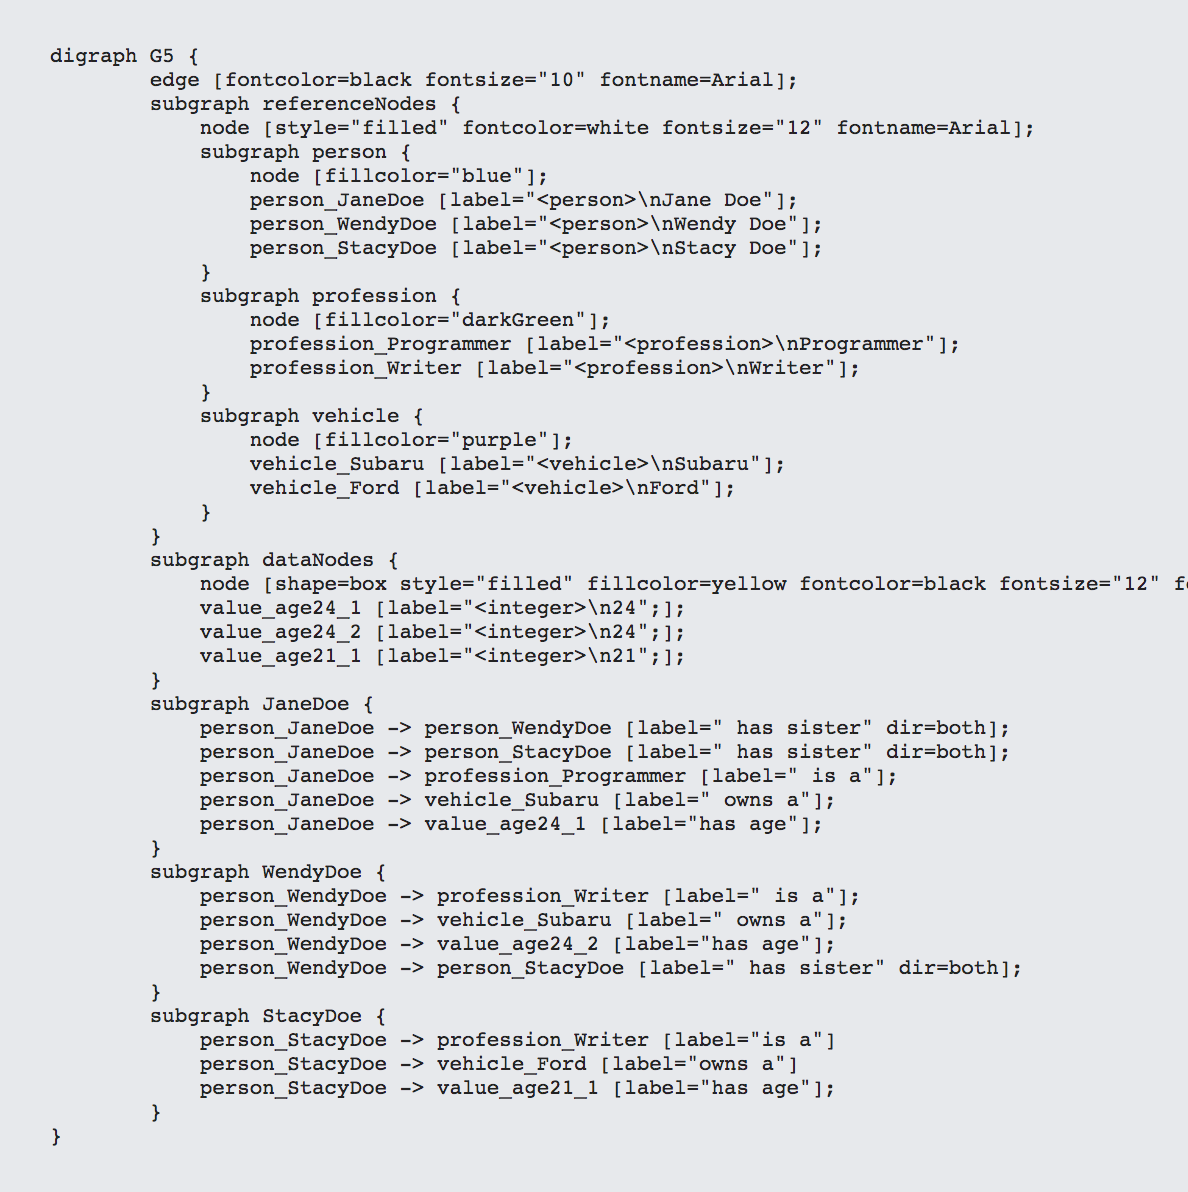

Here we have the tale of three sisters, Jane, Wendy, and Stacy Doe. Wendy and Stacy are both writers, while Jane is a programmer. Wendy and Jane drive Subarus, while Stacy drives a Ford. Jane and Wendy are both 24, Stacy is 21.
The subgraphs in G5 serve to create logical groupings based upon common type. The hasSister relationship is noteworthy because of its symmetry - there are arrowheads on both sides, set by the dir=both attribute. The has age relationship is also noteworthy in that you have an ellipse (the default) pointing to a box as specified via the shape attribute. There are roughly thirty shapes in the core DOT specification, although different implementations may offer more or fewer. Also notice that atomic values (in the rectangles) are defined with an identifier that is unique per box, (e.g., value_age24_1 vs. value_age24_2. Without this distinction, the arrows for age24 would all point to the same box (Proponents of semantics might argue that they should point to the same box, but this can make for confusing graphs if you have a large number of atomic values).
Note also that, unless otherwise specified, DOT will usually create curved edges when you have topologies that don't fit neatly into rectangular arrays. DOT, out of the box, attempts to optimize for tension and legibility, though it is possible to change how nodes and edges are laid out that are fodder for a more advanced article. Other capabilities not covered here (and likely will be covered in a subsequent article) include the use of images, an understanding of how to utilize shapes, and the incorporation of HTML content.
DOT (via the command line GraphViz library or through node and related libraries) is capable of producing PNG and SVG versions of graphics, and some implementations include support for TIFF, JPEG, Postscript and other outputs. DOT is (with a few exceptions) consumable by both the vis.js and d3.js node libraries, among others. You can also find up to date documentation on both GraphViz and DOT on the GraphViz Documentation page.
It should also be pointed out that, as you gain proficiency with DOT, patterns for utilizing it to build different types of network graphs programmatically should become more and more evident. These will be explored in a subsequent article as well. Regardless, DOT can be used to build not only network graphs but flowcharts and state diagrams as well, making it a useful tool for any data scientist or programmer who would prefer not to have to recreate the wheel for visualizations.
A version of this article first appeared on Data Science Central.

I love your explanation, literally not getting bored
You are such an amazing instructor Kurt. Thanks for the different examples.
Amazing resource !!
Many thanks...
Kurt is the founder and CEO of Semantical, LLC, a consulting company focusing on enterprise data hubs, metadata management, semantics, and NoSQL systems. He has developed large scale information and data governance strategies for Fortune 500 companies in the health care/insurance sector, media and entertainment, publishing, financial services and logistics arenas, as well as for government agencies in the defense and insurance sector (including the Affordable Care Act). Kurt holds a Bachelor of Science in Physics from the University of Illinois at Urbana–Champaign.
BBN Times connects decision makers to you. Experts in their fields, worth listening to, are the ones who write our articles. We believe these are the real commentators of the future. We quickly and accurately deliver serious information around the world. BBN Times provides its readers human expertise to find trusted answers by providing a platform and a voice to anyone willing to know more about the latest trends. Stay tuned, the revolution has begun.
Leave your comments
Post comment as a guest