Comments (3)
Daryl Rowland
Thank you. Thoroughly explained.
Lee Hambrook
Concise and to the point
Julie Fletcher
Impressive !!!
Gregory Sandrich stops for a few seconds to adjust his jacket. He’s about to meet his son-in-law, an investment banker at Goldman Sachs, for lunch in downtown Manhattan. The retired accountant and grandfather can’t wait to share with his son-in-law the latest investment he’s just made.
Sandrich has always prided himself on being an astute investor. Several years ago, he spotted the tech boom and rode companies like AltaVista.com to dizzying heights.
But unlike other speculators, Sandrich also knew how to exit the market at the right time, selling when the shares in technology companies had hit levels completely out of sync with their underlying value — something he felt best capable of calculating given his background in accounting.
So when a golfing buddy at his country club mentioned an exclusive new investment vehicle to Sandrich, he was naturally skeptical at first. But when Sandrich looked over the prospectus of the firm touting the investments, their consistency of returns piqued his interest. 
That moment when Greg realized his 401(k) was really just an IOU.
Over a 10-year period, the fund that Sandrich was considering had delivered market-beating returns of between 8% and 12% per annum. But before Sandrich decided to allocate a significant portion of his retirements savings into the fund, he first did his homework.
Studying the returns of the fund, which invested primarily in blue chip stocks, while taking options on them as well, sometimes known as a split-strike or collar, Sandrich also used the Sharpe Ratio (a risk-reward ratio) to determine if the fund was worth investing in.
The Sharpe Ratio, authored by Nobel laureate William Sharpe in the first half of the 1990s is a tool used to examine the performance of an investment by adjusting for its risk.
The Sharpe Ratio is reproduced as follows: 
Where,
S = Sharpe Ratio
Rp = Return of portfolio
Rf = Risk-Free rate
σp = Standard deviation of portfolio’s excess return
The Sharpe Ratio measures the excess return (or risk premium) per unit of deviation in an investment asset or a trading strategy, typically referred to as risk.
Using the Sharpe Ratio, Sandrich was convinced that his investment was relatively safe and on the recommendation of his golfing buddy (without whom he would otherwise not have had access to the investment), proceeded to place a sizeable chunk of his retirement with the firm of Bernard L. Madoff Securities LLC.
The rest, as they say, is history.
Bernard Madoff, better known as Bernie Madoff presided over one of the largest Ponzi schemes in history — a staggering US$65 billion is estimated to have been lost in the scheme, along with all of Sandrich’s investment and that of his son-in-law who he also recommended the investment to. 
Ponzi scheme mastermind and man worried about the Tide Pod he had for lunch, Bernard “Bernie” Madoff.
And while Madoff succeeded in his scheme for a variety of reasons, it was the misapplication of the Sharpe Ratio in some cases that led to dozens of investors believing Madoff’s firm as having developed an extraordinary investment savvy.
Ponzi schemes, particularly those such as Madoff’s, with a long duration of operation, would typically provide a high Sharpe Ratio when derived from reported returns, but the inputs are false.
Had investors derived the performance of the underlying assets that Madoff’s firm was investing in, as opposed to the firm’s purported returns — they would have quite quickly discovered that the firm’s results were more fiction than fact.
Therein lies the difficulty with using tools such as the Sharpe Ratio for calculating investment returns — they’re only as useful as the quality of the data you put in.
Which is why relying on the Sharpe Ratio in cryptocurrency trading is so fraught with difficulty. But that’s not to say that the ratio itself is of limited value. Quite the contrary, it’s how you use it (that’s what she said) that matters.
Even if you’re a Bitcoin maximalist, odds are you’re still paying for your rent and your taxes in fiat currency. So for ease of analysis, I’ve assumed that the purpose of using the Sharpe Ratio to calculate whether or not cryptocurrencies make for a good investment is for growing your fistful of dollars.
The Sharpe Ratio, measures the average return in excess of the risk-free rate of return per unit of volatility, or total risk. Generally, the greater the value of the Sharpe Ratio, the more attractive the risk-adjusted return. 
Broker’s method to obtain a risk-free rate of return was starting to look suspicious.
Now for cryptocurrency trading, the only “risk-free” rate of return is by loaning your existing pools of cryptocurrency to an exchange to fund their liquidity requirements, with the payouts on average of 1% per annum and above, denominated in the cryptocurrency being loaned out.
So for instance if you’re lending out Litecoin, you’ll be receiving 1% interest on that Litecoin.
But even loaning your cryptocurrency out to an exchange is not technically “risk-free” because of the exchange counterparty risk or the risk that the exchange is hacked.
And since our purpose in using the Sharpe Ratio is to increase our dollar holdings, we’ll need to use something else to calculate our risk-free rate of return instead, like a T-Bill, which at the time of writing is 2.4% for a 3-month T-Bill.
So now that we’ve got our Rf value (not quite, it still needs some work, but it’ll do for now), we need to come up with our denominator, the σp (standard deviation of a portfolio’s excess return) value and here’s where it gets tricky.
Whilst it has not been my habit to burden my readers with too much math, this next part may get a bit laborious, so for those who wish, you might want to skip down to the later parts of this piece.
Otherwise, whip out your abacus (that’s what she said) and get ready for some (not too tedious) number crunching. I’ll go as slowly and methodically as possible. 
Also known as non-standard deviation.
Equating volatility to risk in cryptocurrency trading is a tricky business. For starters, volatility depends on the time frame one is looking at and the time one is examining the cryptocurrency market.
Cryptocurrencies can be incredible sedate and incredibly volatile, depending on what time frame one extracts for purposes of using the Sharpe Ratio.
For starters, let’s look at an incredibly short time frame for Bitcoin, a two hour window between 10.00 am and 12 noon (GMT + 8) on February 22, 2019. And for illustration purposes only, let’s use the data from CoinMarketCap.
Now assume that we have a mechanical trading strategy (which is really not much of a strategy at all) of buying at the top of the hour and selling and buying again at 15 minute intervals.
This is by no means a trading strategy, it’s just a random purchase and sale of Bitcoin and is completely arbitrary, but will demonstrate how much a Sharpe Ratio can skew perspectives if not properly understood.
So here goes,
10.00 am — BUY 1 BTC @ US$3,961.48
10.15 am — SELL 1 BTC @ US$3,963.75 — PROFIT US$2.27 (+0.06%)
10.15 am — BUY 1 BTC @ US$3,963.75
10.30 am — SELL 1 BTC @ US$3,971.20 — PROFIT US$7.45 (+0.19%)
10.30 am — BUY 1 BTC @ US$3,971.20
10.45 am — SELL 1 BTC @ US$3,970.00 — LOSS US$1.20 (-0.03%)
10.45 am — BUY 1 BTC @ US$3,970.00
11.00 am — SELL 1 BTC @ US$3,972.45 — PROFIT US$2.45 (+0.06%)
11.00 am — BUY 1 BTC @ US$3,972.45
11.15 am — SELL 1 BTC @ US$3,973.37 — PROFIT US$0.92 (+0.02%)
11.15 am — BUY 1 BTC @ US$3,973.37
11.30 am — SELL 1 BTC @ US$3,972.80 — LOSS US$0.57 (-0.01%)
11.30 am — BUY 1 BTC @ US$3,972.80
11.45 am — SELL 1 BTC @ US$3,971.70 — LOSS US$1.10 (-0.03%)
11.45 am — BUY 1 BTC @ US$3,971.70
12.00 pm — SELL 1 BTC @ US$3,970.19 — LOSS US$1.51 (-0.04%)
Our total profit for the entire 2-hour trading session is US$8.71 excluding any trading fees and the percentage return at the end of the exercise is 0.22% in total.
Now remember, this isn’t a trading strategy, it assumes that Bitcoin will go up in the 2-hour trading session, and locks in any gains (or losses) made at 15-minute intervals. It’s completely arbitrary.
Now to calculate standard deviation for purposes of the Sharpe Ratio.
The standard deviation (as complicated as that sounds) is just simply a number to measure how spread out numbers are. 
Walter was starting to wonder if his accountant has miscalculated his rate of return.
The symbol for standard deviation is σ (the Greek letter “sigma” and what looks like a tadpole but isn’t — so now here’s something to impress your date with the next time you’re at a Greek restaurant).
And the formula to calculate standard deviation is: 
Don’t throw up just yet, it’s not as complicated as it looks.
So from our 2-hour trading session, we’ve got a bunch of numbers, but what we care about are the percentage returns, because remember, we’re going to be putting this stuff into a Sharpe Ratio later which will be based on percentages.
+0.06, +0.19, -0.03, +0.06, +0.02, -0.01, -0.03, -0.04
So let’s work out the mean (average) of these numbers.
0.06 + 0.19 - 0.03 + 0.06 + 0.02 - 0.01 - 0.03 - 0.04 / 8 = 0.03
(rounded to 2-decimal places)
The Greek symbol μ (pronounced “mu” and the mean of all our values) in the formula above is 0.03.
μ= 0.03
This is the part of the formula that says: 
So what is xi ? It’s the individual x values of +0.06, +0.19, -0.03, +0.06….and so on.
So, we get…
(0.06 - 0.03)² = 0.0009
(0.19 - 0.03)² = 0.0256
(-0.03 - 0.03)² = 0.0036
(0.06 - 0.03)² = 0.0009
(0.02 - 0.03)² = 0.0001
(-0.01 - 0.03)² = 0.0016
(-0.03 - 0.03)² = 0.0036
and finally,
(-0.04 - 0.03)² = 0.0049
Take a sip of water (maybe a Red Bull), we’re not quite done yet.
This simply means we add up all the values we got from the previous step and divide by the number of values that we had to begin with.
In mathematics, this is represented by the Greek symbol “sigma” which is Σ. 
Where “N” is simply the value we go to, in this case 0.0009 (the first value in our series) and the “i = 1” simply means that we add up all the values from where we started at to in our case the eighth value.
So…
0.0009 + 0.0256 + 0.0036 + 0.0009 + 0.0001 + 0.0016 + 0.0036 + 0.0049 = 0.0412
But that’s not the mean yet, we need to divide by the number of values that we have which is done by multiplying by 1/N or the same as dividing by “N” which is the number of values we have, eight in this case.
So the mean of the squared differences is,
(1/8) x 0.0412 = 0.00515
This value is now called the “variance”.
Now take the square root of that. 
σ = √(0.00515) = 0.07
And there you have it, that’s our standard deviation for a 2-hour trading period of Bitcoin buying and selling.
So now let’s put the standard deviation we have into the Sharpe Ratio (it’s ending soon I promise). 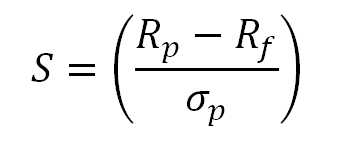
As you will (no doubt) recall, Rp is the return on the portfolio. In this case, 0.22%.
Because we staked the US$3,961.48 to start our trading session and we yielded US$8.71 after 2 hours, our 2-hour return was 0.22%.
But now we need to calculate what the 2-hour rate of return for a T-Bill was, otherwise the equation would be busted for crappy data. 
Grandpa got riled up when he appeared on the Kiss Cam.
And because cryptocurrency markets are 24/7, we’ll just (for ease of calculation) calculate the 2-hour return for a T-Bill over the same time frame. There are secondary markets for T-Bills which are 24/7, so it’s not an entirely unreasonable assumption.
A 3-month T-bill pays out 2.4% over a year (they are annualized), so over 3 months, the risk-free rate of return on a T-bill is:
2.4% / 3 = 0.8%
We’re not done yet. We need to work this into an hourly number. So assuming that each month has 30 days, for ease of calculation,
0.8 / (24 x 90) = 0.00037% per hour
and 0.00074% for two hours.
So now we have all the values that we need for our Sharpe Ratio and let’s put everything together.
S = (0.22 - 0.00074) / 0.07
= 313.83%
That’s right, over a 2-hour period of trading in Bitcoin, the Sharpe Ratio is a whopping 313.83%, which in ordinary investment speak is not just an attractive investment, it’s one that you’d be foolish not to make!
But don’t be fooled by the Sharpe Ratio.
Because remember, there were several underlying assumptions that we (well more like “I”) took when we started on this mathematical journey, the Sharpe Ratio is only really useful to a point — that we took an arbitrary trading strategy in Bitcoin and that we were only going to trade in a 2-hour window.
But as you increase the window of time with which to apply the Sharpe Ratio, the numbers look vastly different because a whole host of other externalities come into play. 
Not a recommend use of the Sharpe Ratio.
For instance, if you stretch the time period examined backwards to a year from today, you’d have captured the highly destructive Bitcoin Cash war, which caused the price of Bitcoin to plummet dramatically and that would have a rather large impact on the standard deviation.
Stretch your data points a little further and you’d capture the unprecedented run-up in Bitcoin’s price to the US$20,000 level again with its distortive effects on the Sharpe Ratio.
Again, depending on the data set you input into your Sharpe Ratio, the results would be dramatically different, because again, risk, or volatility, is heavily dependent on the time frame that you’re using to measure it with.
Just as the Nobel laureates at the now defunct billion-dollar hedge fund, Long Term Capital Management will tell you, ratios and mathematical formulas are only as good as the data and the assumptions you put into them.
The better the quality of your data, the more accurate your calculations.
And therein lies another difficulty when it comes to using a purely formulaic approach when it comes to cryptocurrency trading. 
Remember how we used data from CoinMarketCap for our calculations?
Well the prices on that website are purely representative — they may not necessarily exist anywhere and are algorithmically created based on opaque weightages assigned to various unknown cryptocurrency exchanges.
For a Sharpe Ratio to be useful, the price input and profit calculation need to be gleaned from an actual market place where prices can be realized — something which is a function of market depth as well.
Because many cryptocurrency exchanges allow traders to access their APIs (application programming interfaces), traders can use the Sharpe Ratio (preferably over very short periods of time) to calculate the risk-reward ratio of making a particular trade.
Over extremely short periods of time, the Sharpe Ratio can be used as a risk management tool to determine whether or not an automated trade should or should not be made and can be incorporated as part of an existing trading algorithm to ensure that automated cryptocurrency trading is within the risk management policies of a trader.
But that doesn’t mean that it’s foolproof.
Because there is no way to forecast with a high degree of accuracy Black Swan-type events in cryptocurrency trading, there will always be the risk that automated trading algorithms continue to trade during periods of extreme volatility.
For that, a trader’s knowledge of fundamental indicators, such as impending soft and hard forks, developmental support, blockchain development, application build-out and other issues which cannot be captured from price data alone, become highly relevant in ensuring the smooth running of automated cryptocurrency trading programs.
Many of the tools drawn from the capital markets are helpful in cryptocurrency trading, but almost all of them will require some degree of modification and a high degree of monitoring to ensure their maximum efficacy.

Thank you. Thoroughly explained.
Concise and to the point
Impressive !!!
Patrick is an innovative entrepreneur and a lawyer passionate about cryptocurrencies and the business world. He is the CEO of Novum Global Technologies, a cryptocurrency quantitative trading firm. He understands the business concerns of founders and business people helping them to utilise the legal framework to structure their companies to take advantage of emerging technologies such as the blockchain in order to reach greater heights. His passion for travel, marketing and brand building has led him across careers and continents. He read law at the National University of Singapore and graduated with Honors in the Upper Division and joined one of Singapore’s top law firms, Allen & Gledhill where he was called to the Singapore Bar as an Advocate & Solicitor in 2005. He created Purer Skin, a skincare and inner beauty company which melds the traditional wisdom of ancient Asian ingredients such as Bird's Nest with modern technology. In 2010, his partner and himself successfully raised $589,000 from the National Research Foundation of Singapore under the Prime Minister’s Office. He has played a key role in the growth of Purer Skin from 11 retail points in Singapore to over 755 retail points in Singapore and 2 overseas in less than a year. He taught himself graphic design, coding, website design and video editing to create the Purer Skin brand and finished his training at a leading Digital Media Company.
BBN Times connects decision makers to you. Experts in their fields, worth listening to, are the ones who write our articles. We believe these are the real commentators of the future. We quickly and accurately deliver serious information around the world. BBN Times provides its readers human expertise to find trusted answers by providing a platform and a voice to anyone willing to know more about the latest trends. Stay tuned, the revolution has begun.
Leave your comments
Post comment as a guest