Comments
- No comments found

You will notice many different patterns and labeling as you study harmonic price patterns.
You may also find that some traders apply their own ideas to the same pattern, which gives them a slightly different appearance. The three most popular harmonic patterns are the Gartley, Crab, and Bat patterns, but there are dozens of other patterns used by day traders in Foreign exchange trading.

Harmonic traders use several ratios found in the Fibonacci sequence to determine where to place reversal zones. The ratios they use include .382, .50, .618, and 1.618 - also known as retracement levels. These ratios are found all over nature and have been used in finance for decades.
Every harmonic pattern is based on these ratios and retracement levels, which act as reversal zones for prices going up or down.
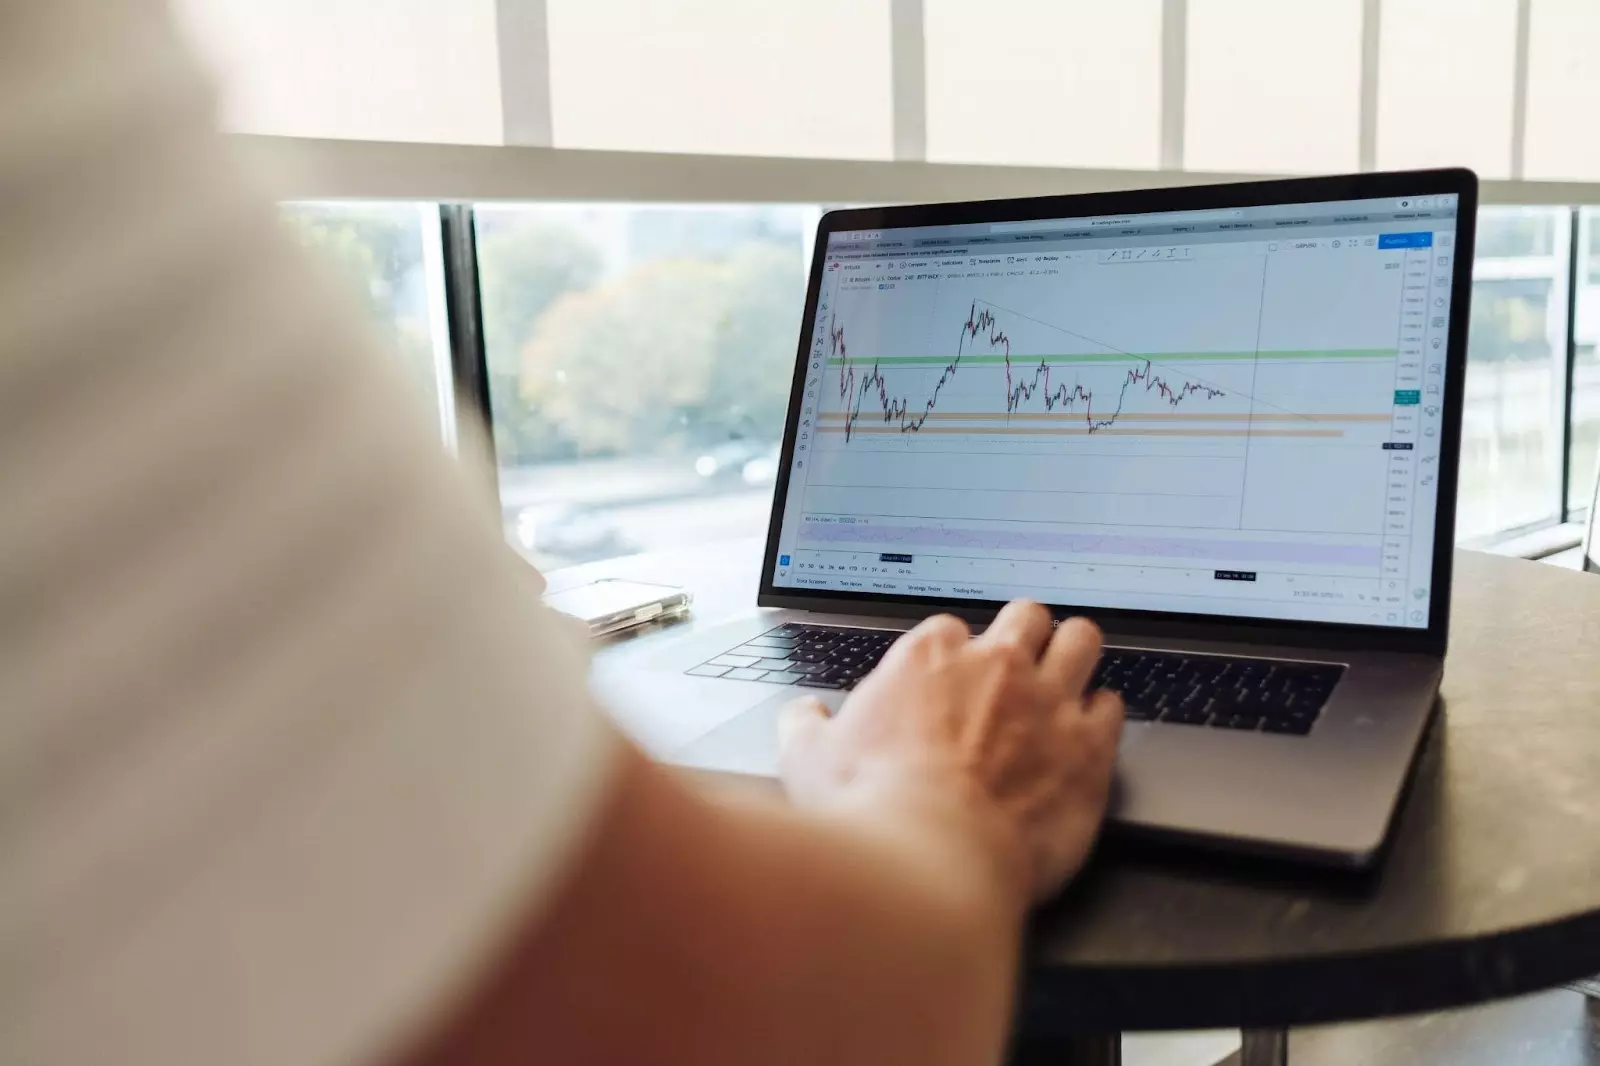
Harmonic price patterns are part of harmonic trading, which uses the Fibonacci ratio in price patterns to pinpoint reversal points in the markets.
A price pattern is a shape or structure that you can see on your chart. Harmonic trading uses specific Fibonacci patterns to predict the future movement of a financial instrument. These patterns are called harmonic price patterns and include:
Gartley pattern - This is one of the oldest harmonic patterns still used today, which makes it very well-known among day traders. In the Gartley pattern, you'll see a retracement followed by another move in the opposite direction. The second retracement is smaller than the first one, meaning it doesn't return to the beginning of XA (the first leg). Instead, it stops at 78.6% of XA at point B (the second leg). The final move in an upward direction ends up being CD (the third leg), approximately 127% of XA.
Crab pattern - When trading with this harmonics pattern strategy, you should look for XA (the first leg) to end near 161%, so BC (the second leg) can end near 261%. At this point, D (the third leg) might stop at around 361%, giving us a perfect crab pattern on our hands.
Bat pattern - After finding your 0.886 Fibonacci retracement level with point A as your starting point and B as your ending one, you should wait until C shows up near 1.13 or 1.618 Fibonacci extension level in relation to AB swing before making any moves regarding opening or closing positions with this particular harmonic pattern strategy.
Traders use technical analysis to evaluate the market and help them make trading decisions.
Patterns are a way of finding entry and exit points for trades, making them an essential tool for traders looking to profit from movements in the market. These patterns predict when turning points might occur, helping you time your trades better. They're also helpful because they show how traders think about the market—and other people's decisions tend to influence price movements as much as any actual events in the underlying economy.
The patterns represent market psychology at work, as well as the levels of support and resistance
Harmonic price patterns are a complex trading method that uses Fibonacci ratios and numbers to identify potential support and resistance levels in an asset's price.
In order for a harmonic pattern to form, there must be several reversal zones—areas where the price action will reverse and change direction. By identifying these reversal zones, traders can look for specific patterns that represent market psychology at work, as well as the levels of support and resistance.
When trying to trade a reversal, you want to pinpoint the exact point where things will start to turn around.
While you may be familiar with Fibonacci ratios for predicting retracements and extensions, this strategy does not use them for those purposes. Instead, it takes advantage of the fact that financial markets are often influenced by these mathematical relationships found in nature. When a market is at a key ratio level, it can result in a reversal or continuation of the underlying trend.
Disclaimer: This article is for informational purposes only and does not constitute a recommendation or investment advice. You should not construe any such information or other material as legal, tax, investment, trading, financial, or other advice. Please seek a professional financial advisor before making any investment decision. We are not responsible for and do not endorse or accept any responsibility for the availability, contents, products, services or use of any third party website as stated in our privacy policy.
BBN Times connects decision makers to you. Experts in their fields, worth listening to, are the ones who write our articles. We believe these are the real commentators of the future. We quickly and accurately deliver serious information around the world. BBN Times provides its readers human expertise to find trusted answers by providing a platform and a voice to anyone willing to know more about the latest trends. Stay tuned, the revolution has begun.
Leave your comments
Post comment as a guest