Comments
- No comments found

The Congressional Budget Office has published “The Distribution of Household Income, 2018” (August 2021). It takes a couple of years to pull this data together in a reliable way.
The report is full of data and figures about inequality of income over time, together with what the patterns of inequality would look like with adjustments for non-market income (like Social Security), taxes paid, and means-tested benefits received. Here are a few of the images that caught my eye.
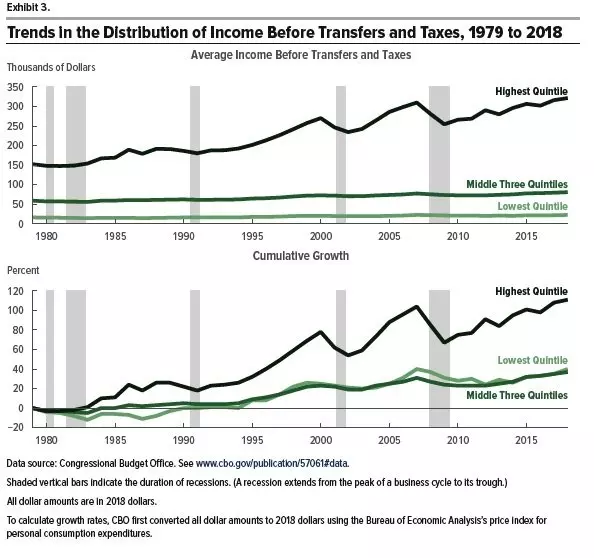
A variety of the figures confirm the well-known fact that inequality of US incomes has expanded in recent years, with the biggest gains at the very top of the income distribution. For example, the upper figure shows average income in dollars for the top quintile (fifth) compared to the rest of the income distribution. The second panel shows cumulative growth over time as a percentage amount. These calculations look only at income, without taking taxes or transfer payments into account.
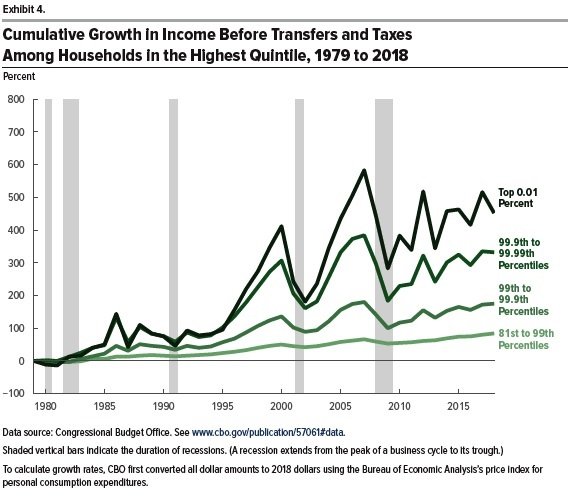
The next figure breaks down the top fifth into smaller categories, and shows cumulative income growth for these subgroups. As you can see, cumulative income growth (again, not counting taxes or transfers) has been fastest at the very top for the growth for the top 0.01 percent of the income distribution.
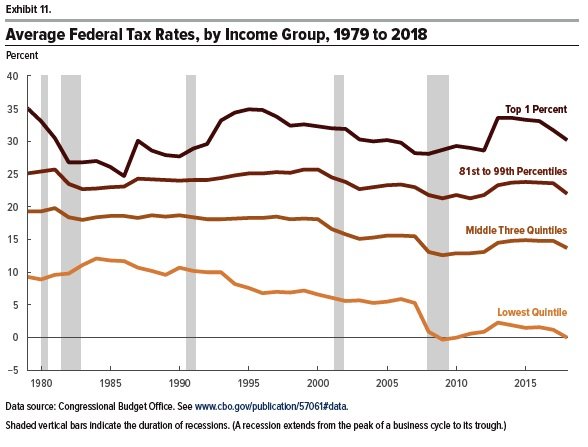
If we take taxes into account, an interesting pattern is that the average federal tax rate for the top 1% and the top fifth haven’t changed much since the 1990s. (This calculation combines all federal taxes paid, not just income tax.) However, average federal tax rates have fallen during that time for the rest of the income distribution, especially the bottom quintile. Thus, the share of taxes paid by those with higher income as been rising over time.
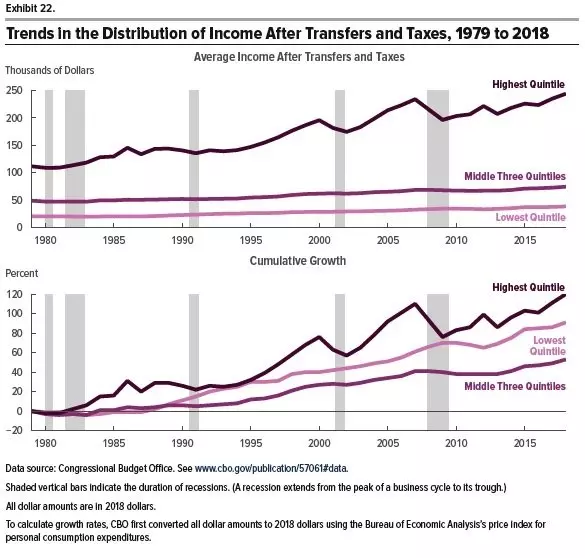
What if we now focus on income after taxes and transfer payments? Here, an interesting pattern emerges in the bottom panel of the next figure: the percentage growth in income for the bottom fifth is actually fairly close to that for the top fifth: it’s the middle three-fifths that has slower income growth by this measure. One underlying reason, noted above, is that taxes have fallen by more for the bottom fifth. Another reason is that the cost of health care means that Medicaid payments for the bottom fifth have risen.
Finally, here’s a measure of how the inequality of the US income distribution has been shifting using the Gini coefficient, a standard measure used in these comparisons.
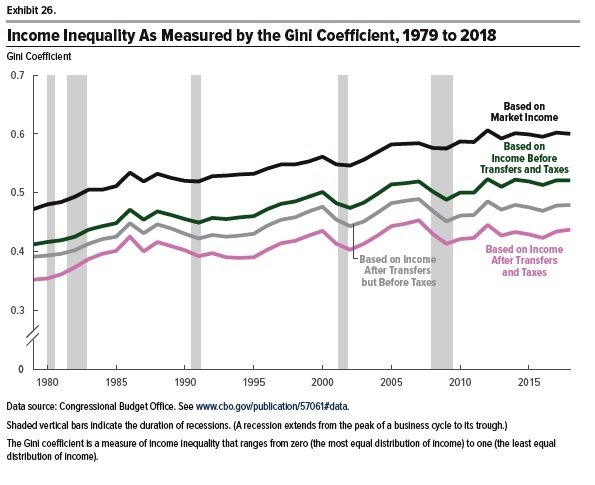
The top line shows rising income inequality is market incomes. The second line shows lower inequality, but still rising if one includes nonmarket sources of income like Social Security and Medicare. The third line adds means-tested benefits like food stamps, Medicaid, welfare payments, and so on. These reduce inequality further, and you will notice that with these adjustments, the rise in inequality is to some extent flattened out. The bottom line is income after taxes and transfer payments. By this measure, it’s striking to notice, the rise in inequality since about 1990 has been almost entirely leveled out. The Gini coefficient for this measure was .437 in the US economy in 2018; for comparison, it was .435 back in 2000 and .425 in 1986. In other words, the rising inequality in market incomes in the last few decades has been mostly offset by changes in federal government tax and transfer payments.
It’s worth noting that the Gini coefficient measure, while very commonly used, has all the standard problems that occur when you try to boil down the entire income distribution to a single number. In this case, in particular, remember the figure above showing the rise for the lowest quintile after taxes and transfers were taken into account. Thus, one way to think about the shifting inequality of the income distribution over time is that the top fifth and the bottom fifth have grown by more than the middle. Overall, this pattern means that overall the distribution of income has not become more unequal. But if you’re in the middle three-fifths, you haven’t been keeping up.
Timothy Taylor is an American economist. He is managing editor of the Journal of Economic Perspectives, a quarterly academic journal produced at Macalester College and published by the American Economic Association. Taylor received his Bachelor of Arts degree from Haverford College and a master's degree in economics from Stanford University. At Stanford, he was winner of the award for excellent teaching in a large class (more than 30 students) given by the Associated Students of Stanford University. At Minnesota, he was named a Distinguished Lecturer by the Department of Economics and voted Teacher of the Year by the master's degree students at the Hubert H. Humphrey Institute of Public Affairs. Taylor has been a guest speaker for groups of teachers of high school economics, visiting diplomats from eastern Europe, talk-radio shows, and community groups. From 1989 to 1997, Professor Taylor wrote an economics opinion column for the San Jose Mercury-News. He has published multiple lectures on economics through The Teaching Company. With Rudolph Penner and Isabel Sawhill, he is co-author of Updating America's Social Contract (2000), whose first chapter provided an early radical centrist perspective, "An Agenda for the Radical Middle". Taylor is also the author of The Instant Economist: Everything You Need to Know About How the Economy Works, published by the Penguin Group in 2012. The fourth edition of Taylor's Principles of Economics textbook was published by Textbook Media in 2017.
BBN Times connects decision makers to you. Experts in their fields, worth listening to, are the ones who write our articles. We believe these are the real commentators of the future. We quickly and accurately deliver serious information around the world. BBN Times provides its readers human expertise to find trusted answers by providing a platform and a voice to anyone willing to know more about the latest trends. Stay tuned, the revolution has begun.
Leave your comments
Post comment as a guest