Comments
- No comments found

The ability to access and utilize data in a timely manner is essential for data-driven decision making.
Implementing effective data and analytics solutions that significantly influence a company depends on many different factors, including technology, data and analytics KPI, governance, and more.
Among them, data and analytics KPI is one crucial aspect that serves as a centerpiece in data and analytics.
Data is referred to as the pieces of information that have been converted into a format that can be moved or processed quickly. Data is information, transformed into binary digital form for use with modern computers and communication mediums. In its simplest basic digital form, data is referred to as "raw data." On the other hand, analytics combines data and arithmetic to make predictions about the future, identify relationships and automate decision-making. Based on applied mathematics, predictive modeling, statistics and machine learning approaches, this broad area of computer science is used to detect significant patterns in data and unearth new understanding. These days, a majority of firms view analytics as a key asset, and it plays a crucial role in many essential functions and competencies.
KPIs, or key performance indicators, on the other hand, are tools that can help businesses in monitoring and measuring their key performances to achieve organizational goals. KPIs play a crucial role in assisting an entire organization’s efforts to ensure that they meet their desired end results. KPIs are important for organizations because they can help them in ensuring that all the teammates are providing value by tracking their performances with the help of key performance indicators. Furthermore, talking about KPIs in data and analytics, businesses can make the most of their data and analytics by tracking key measures for the same. With this understanding of data, analytics, and KPIs, let’s further explore data and analytics KPIs.
An organization can perform best when it sets a target and achieves them in a timely manner. However, to measure if they are on the right track, having KPIs set for the same can be crucial. While tracking performance for your data and analytics, there are various key performance indicators or KPIs to look into. Given below are a few data and analytics KPIs.
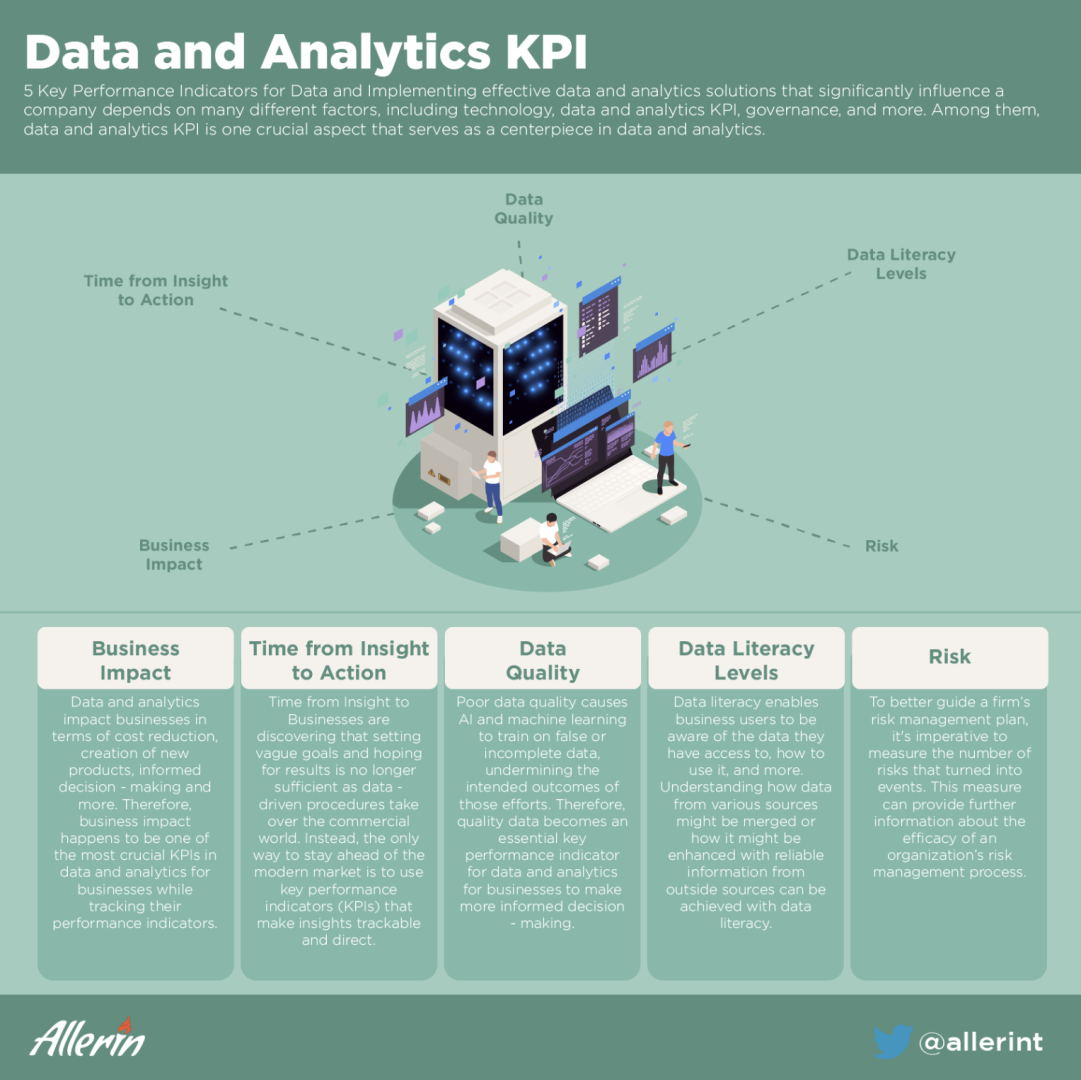
With the assistance of data and analytics, businesses aim at providing the best customer experience to their customers. After all, better customer service assists businesses in increasing profits. Organizations may harness their data and use data and analytics to find new opportunities in the market. This results in wiser company decisions, more effective operations, greater profitability and happier clients. Businesses that employ data and analytics benefit in a variety of ways. Moreover, data and analytics impact businesses in terms of cost reduction, creation of new products, informed decision-making and more. Therefore, business impact happens to be one of the most crucial KPIs in data and analytics for businesses while tracking their performance indicators.
Many businesses need help understanding their data and deriving value from their significant data investments to incorporate actions through proper insights. Additionally, actionable insight is one of the many buzzwords circulating in the business world. Businesses are discovering that setting vague goals and hoping for results is no longer sufficient as data-driven procedures take over the commercial world. Instead, the only way to stay ahead of the modern market is to use key performance indicators (KPIs) that make insights trackable and direct. The issue is that even though KPIs are now routinely implemented by most firms, a surprising amount of managers still need help making their insights actionable.
Actionable insights must always start with precise business objectives. After all, taking action will only be possible if the business knows what they are tracking. This is an incredibly crucial fundamental aspect in the era of big data. Therefore, the implementation of clearly defined business goals coupled with targeted KPIs enables the production of actionable insights that are always geared toward priorities. Although to better use insights is to also understand that it all starts with unfiltered data. Data is the unfiltered, raw fact typically presented as numbers and text. Data might be qualitative or quantitative in its form. It generally resides in databases and spreadsheets and is available in computer-friendly formats. Data that has been processed, compiled and organized into a more readable format with additional context is called information. Reports, dashboards and data visualizations are common ways to present information. The process of examining data and coming to conclusions produces insights. Both data and information enable the finding of insights that can then affect decisions and spur change. Although one can draw as many conclusions as possible from data, not all will be actionable. Some ideas can be beyond your comprehension, and you might decide to dismiss them. In general, an insight that motivates action is more important than one that only provides a response, especially if it forces you to reconsider something and steers you in a different direction.
For instance, a Fitbit watch provides various activity information, including steps, miles, calories burned, and BPM (heartbeats per minute). The watch currently indicates how many steps you have taken. Without additional context, this information is largely meaningless. Numerous data tables and information visualizations are available in the Fitbit app too, including a weekly steps report. This trended data explains if you are on a better trajectory than before. With a little extra effort, you could meet your daily goal, whereas insight tells how many steps you need to complete in the next hour to achieve your target. Therefore, having actionable insights as one of the KPIs is significantly beneficial for any business to progress in the right direction.
Data quality is essential because it determines whether information can be used for its intended purpose in a given context. Inadequate data can result in expensive errors, lost productivity and subpar business decisions. Your business could lose money by sending out multiple mailings or shipping items to the wrong addresses if client data contains duplicate records or incomplete or incorrect information. Everyday business operations are frequently delayed by these mistakes because data entry staff must deal with the confusion they produce.
Most crucially, terrible business decisions are caused by poor data quality. Your firm may end up with a product that performs poorly, resulting in lost sales and dwindling market share if customer analytics suggest that moving forward with a new product idea is best for the company, but those analytics later prove to have been influenced by inaccurate data. The same worries surface when AI and machine learning become more important in guiding operational decisions. Poor data quality causes AI and machine learning to train on false or incomplete data, undermining the intended outcomes of those efforts. Therefore, quality data becomes an essential key performance indicator for data and analytics for businesses to make more informed decision-making.
Knowledge of data literacy is crucial for current business goals. Today, more data than ever is available to business users, but if they are unable to comprehend and interpret it, they won't be able to make use of all of its value-creating potential. Data quality, teamwork, innovation and work process efficiency can increase for organizations that support data literacy. In practice, data literacy entails more gains with fewer drawbacks. Data literacy enables business users to be aware of the data they have access to, how to use it, and more. Understanding how data from various sources might be merged or how it might be enhanced with reliable information from outside sources can be achieved with data literacy. It allows business users to comprehend how geographical context might be used to provide deeper insights and better decision-making. And when responsible individuals are data literate, they can help organizations function better and with more data accuracy. Therefore, implementing data literacy levels as a key performance indicator is extremely important to better understand and track key performances.
Managing and tracking risk is not a newfound idea. It has long been an organization’s responsibility to be aware of the risks that can put a firm in a vulnerable position. But what's new is how much more people are becoming aware of the significance of risk management. The regulatory and economic climates have gotten more difficult, and the news is full of stories about what happens to firms when risks aren't properly handled. The sheer volume of tasks and resources that come with global expansion can make risk management even more difficult. Designing effective risk management methods can be challenging since many dangers are not immediately apparent. However, it's critical to keep track of how many risks have been found in various parts of your firm. By doing this, you can better understand possible dangers and vulnerabilities. To better guide a firm’s risk management plan, measuring the number of risks that turned into events is imperative. This measure can provide further information about the efficacy of an organization’s risk management process. However, for an organization to smoothly function, tracking risk becomes a crucial performance indicator.
Modern organizations place a specific emphasis on data and analytics since they can enhance the results of all kinds of decisions, be it real-time, micro, macro, etc. In addition, data and analytics can potentially uncover opportunities and questions that have not been considered by business leaders before. However, it is crucial to undertake data and analytics KPI to monitor and measure the performance indicators and keep track of data and analytics in businesses to thrive and better achieve organizational goals faster and more effectively.
Naveen is the Founder and CEO of Allerin, a software solutions provider that delivers innovative and agile solutions that enable to automate, inspire and impress. He is a seasoned professional with more than 20 years of experience, with extensive experience in customizing open source products for cost optimizations of large scale IT deployment. He is currently working on Internet of Things solutions with Big Data Analytics. Naveen completed his programming qualifications in various Indian institutes.
BBN Times connects decision makers to you. Experts in their fields, worth listening to, are the ones who write our articles. We believe these are the real commentators of the future. We quickly and accurately deliver serious information around the world. BBN Times provides its readers human expertise to find trusted answers by providing a platform and a voice to anyone willing to know more about the latest trends. Stay tuned, the revolution has begun.
Leave your comments
Post comment as a guest