You’ve likely heard the popular guideline that if you find yourself copying and pasting code more than 3 times, you should write it as a function.
While you can write and store these functions at the top of your R Markdown files, this approach can get messy and is counterproductive if you end up copying and pasting the functions into multiple files. Often, the best way to stay organized is to write your functions in a script and to call them from any additional files where they’re needed.
To demonstrate this process, I will use 3 functions to conduct a very simple change point analysis of Google searches containing the words “supreme court” over the past month.
First, Create Your Functions
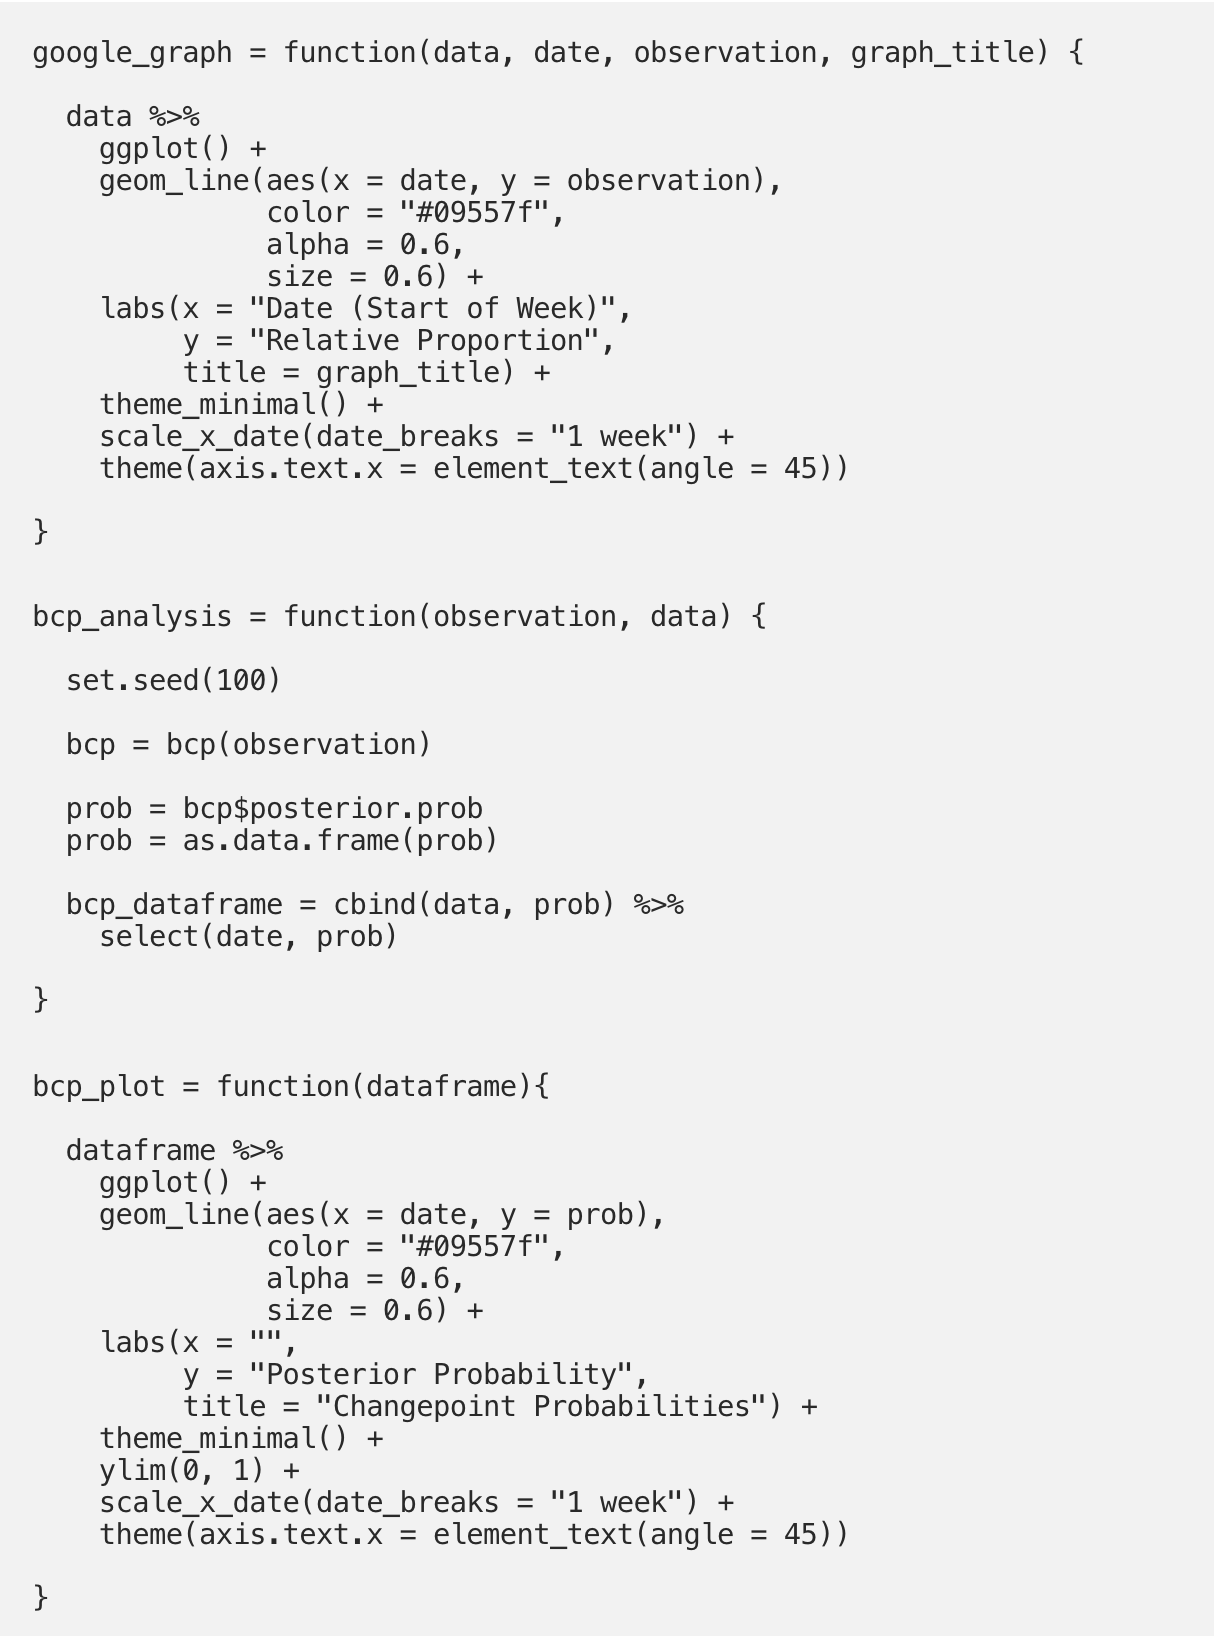
In an R script, we write three simple functions. The first plots the Google Trends data, the second performs a simple change point analysis using the bcp() function from the “bcp” package, and the third plots the results of this analysis.
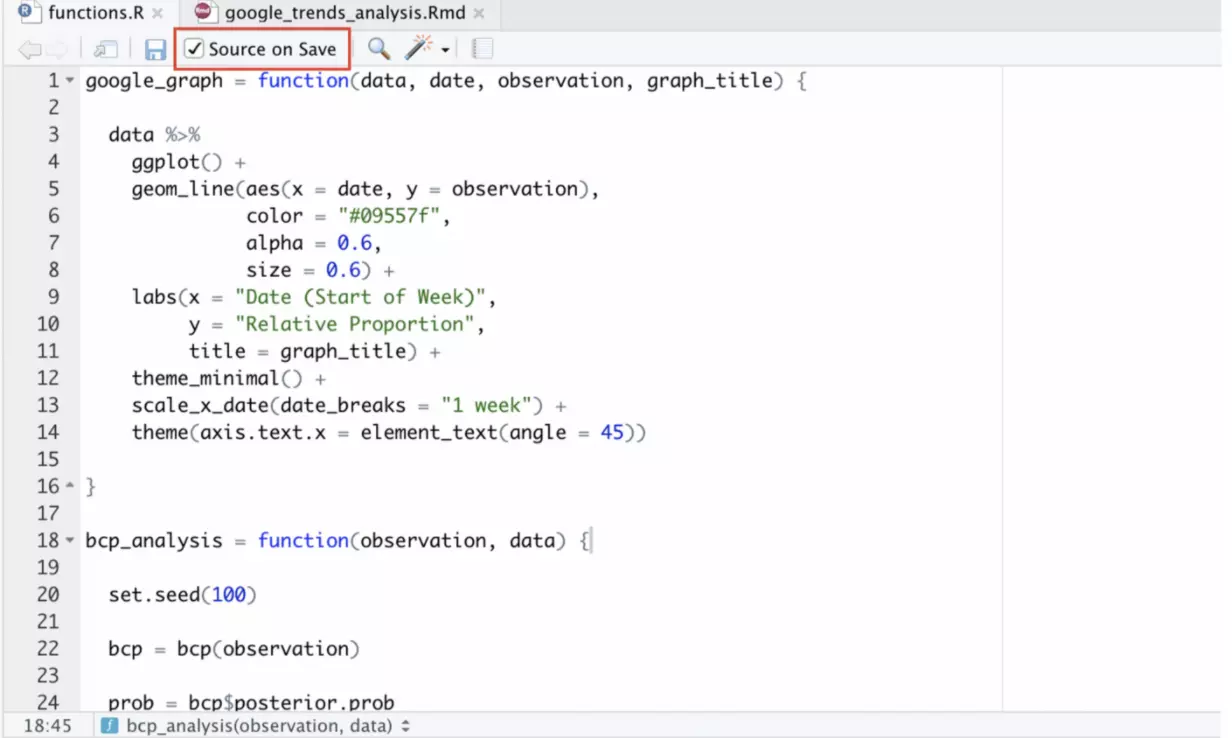
I’ve also checked this “Source on Save” box. If you check this box, then the file will be sourced automatically to the global environment when you save changes to your functions in the script.
Connect to Your Functions
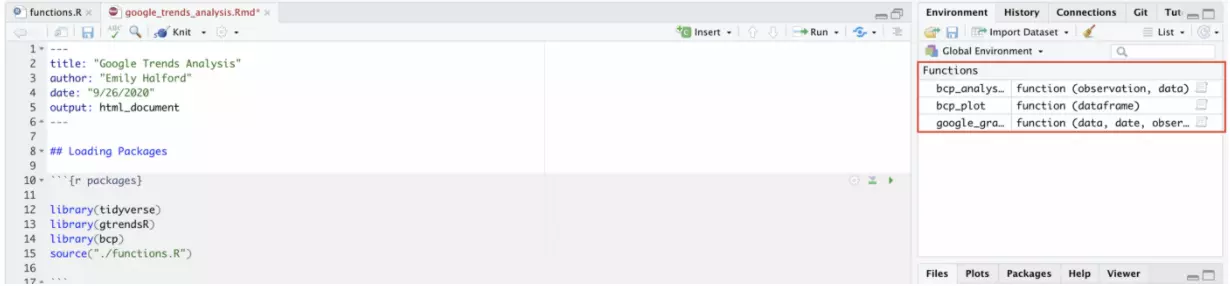
Connecting to functions stored in a script from an R Markdown file is very similar to connecting to functions stored in a package. Instead of using a library() statement, we use a source() statement and indicate the script’s path name. In this case, we use the following code:

When we run this line of code, the functions contained within the script automatically appear in the Global Environment. The connection was successful!
Use Your Functions
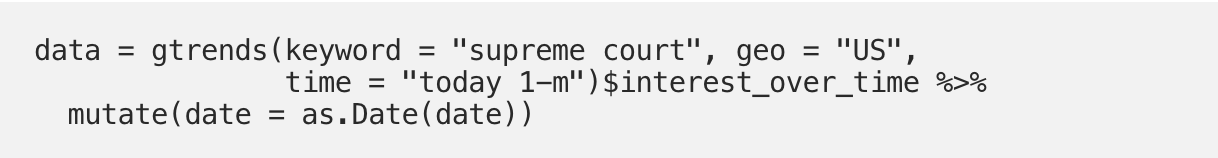
First, we’ll just use the gtrends() function from the “gtrendsR” package to pull Google search volume for searches containing the words “supreme court” in the United States over the past month. A mutate step is also used to convert the “date” variable to a date format:
Now we have data to use in our functions! We use the google_graph() function the same way we would use any other function, allowing us to easily plot the data:

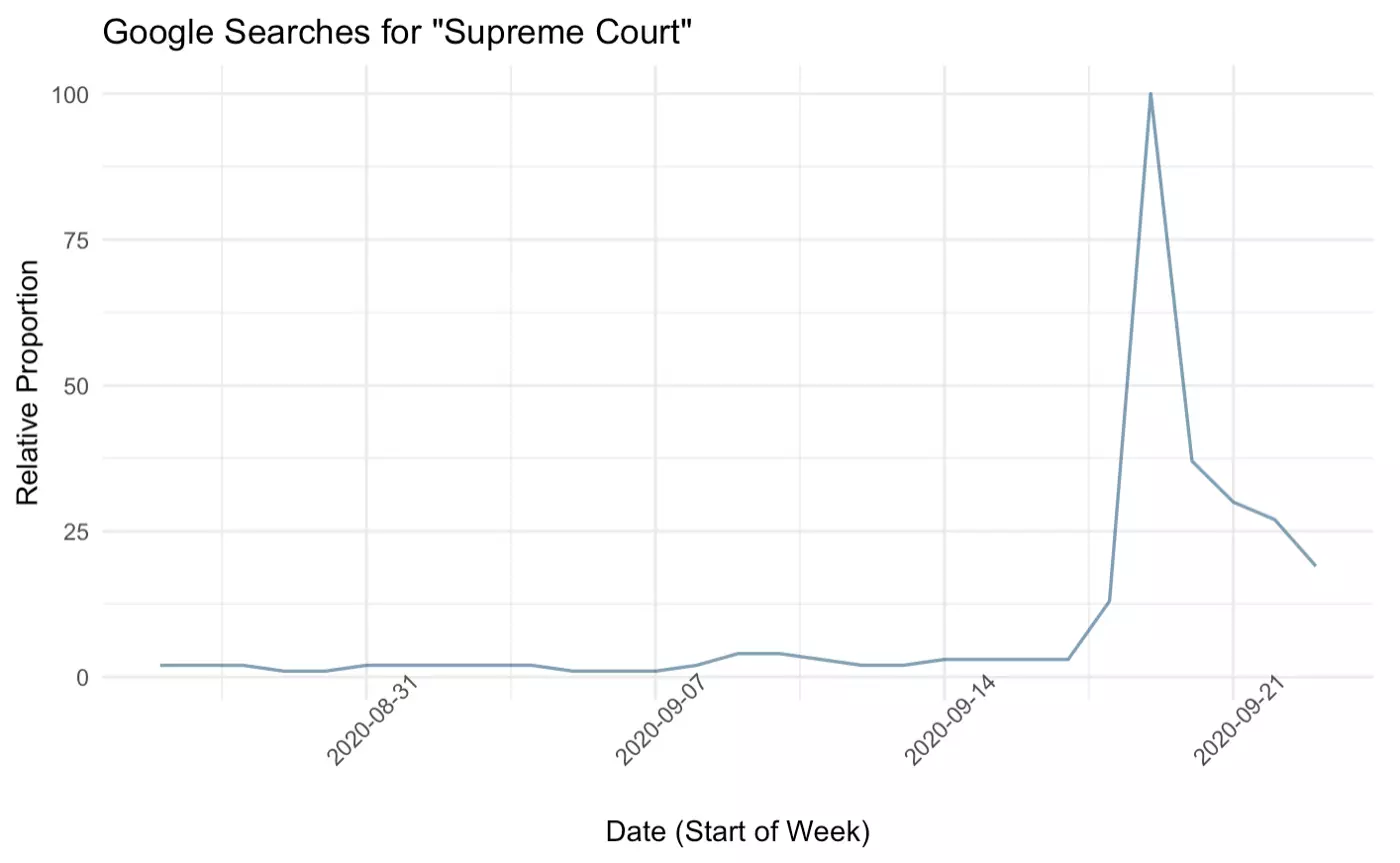
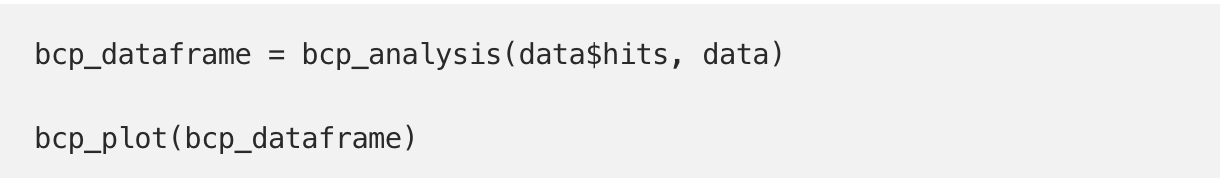
The plot looks good! Unsurprisingly, there is a massive surge in searches containing “supreme court” following the death of Supreme Court Justice Ruth Bader Ginsburg. Let’s use the bcp_analysis() and bcp_plot() functions to see if this spike represents a significant change point in this time-series object. Again, we use the functions the same way we would if we were using functions from a loaded package:
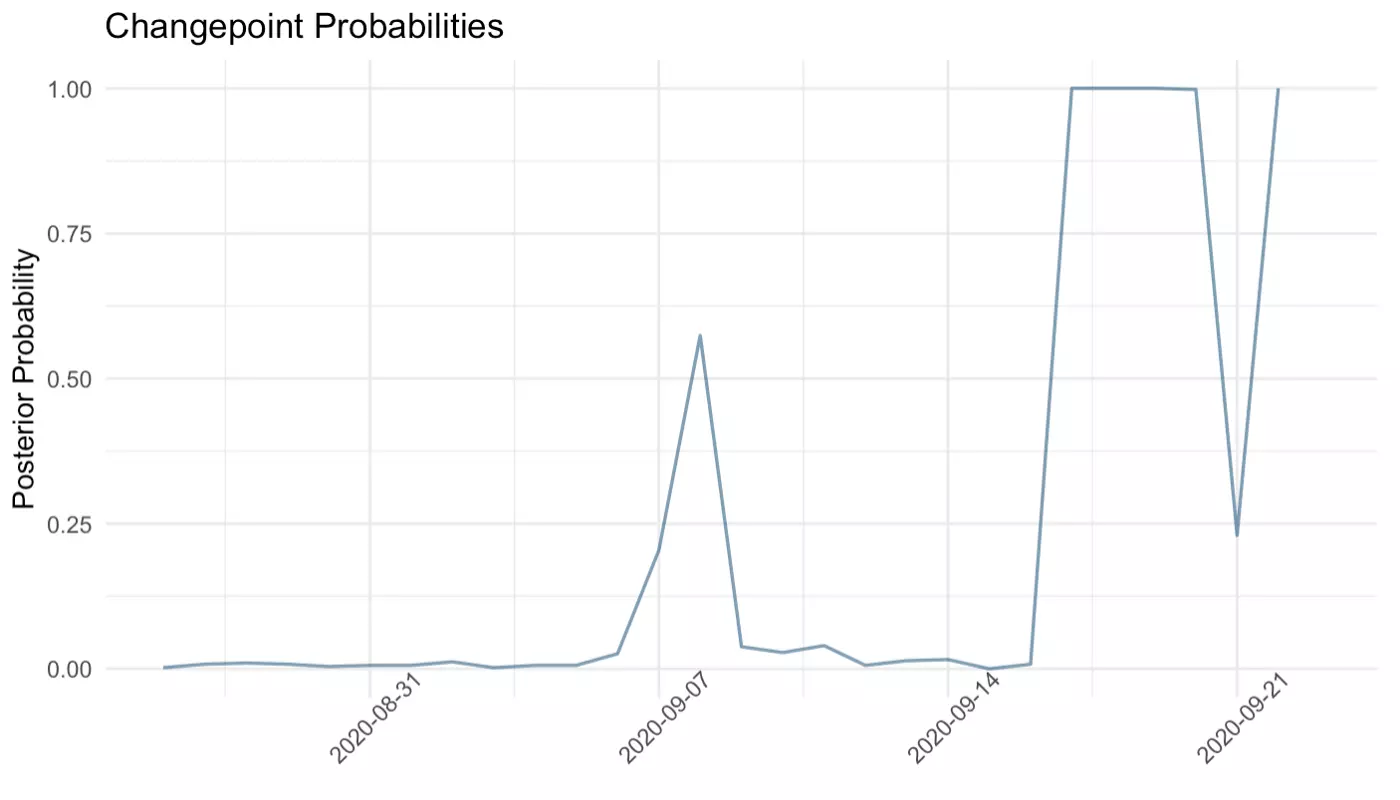
Several days following the death of Ruth Bader Ginsburg have posterior probabilities of 1.00, indicating that searches containing the words “supreme court” likely changed in a statistically meaningful way around this time.
It’s as simple as that! If we wanted to plot and analyze several different sources of data in separate Rmd files, it would be as easy as connecting those files to our “functions” script with a source() statement and using our functions.


Leave your comments
Post comment as a guest