Comments (4)
Jonathan Turner
Thanks for the clear explanation
Laura Woodhead
Useful info
Diego L
Good job Emily, nailed it with your explanation.
Robert Squirrell
This is very inspirational and helpful for data scientists.

A few weeks ago, I wrote an article using historical population data from numerous US cities.
While much of this data came from directly from the US Census, I also scraped population data from Wikipedia tables which compile all available data for each city in one place. While it’s worth verifying the original sources of data found through Wikipedia, this online encyclopedia contains a wealth of information that is often worth scraping.
In this article I will sharethe code I used to scrape one Wikipedia table containing historical population data for Houston, Texas. This code can easily be adapted to scrape tables from other Wikipedia pages or other webpages entirely. The approach I will walk through is based off of material taught in one of my graduate school Data Science courses.
First, let’s take a look at the table that we’ll be scraping (outlined in red):
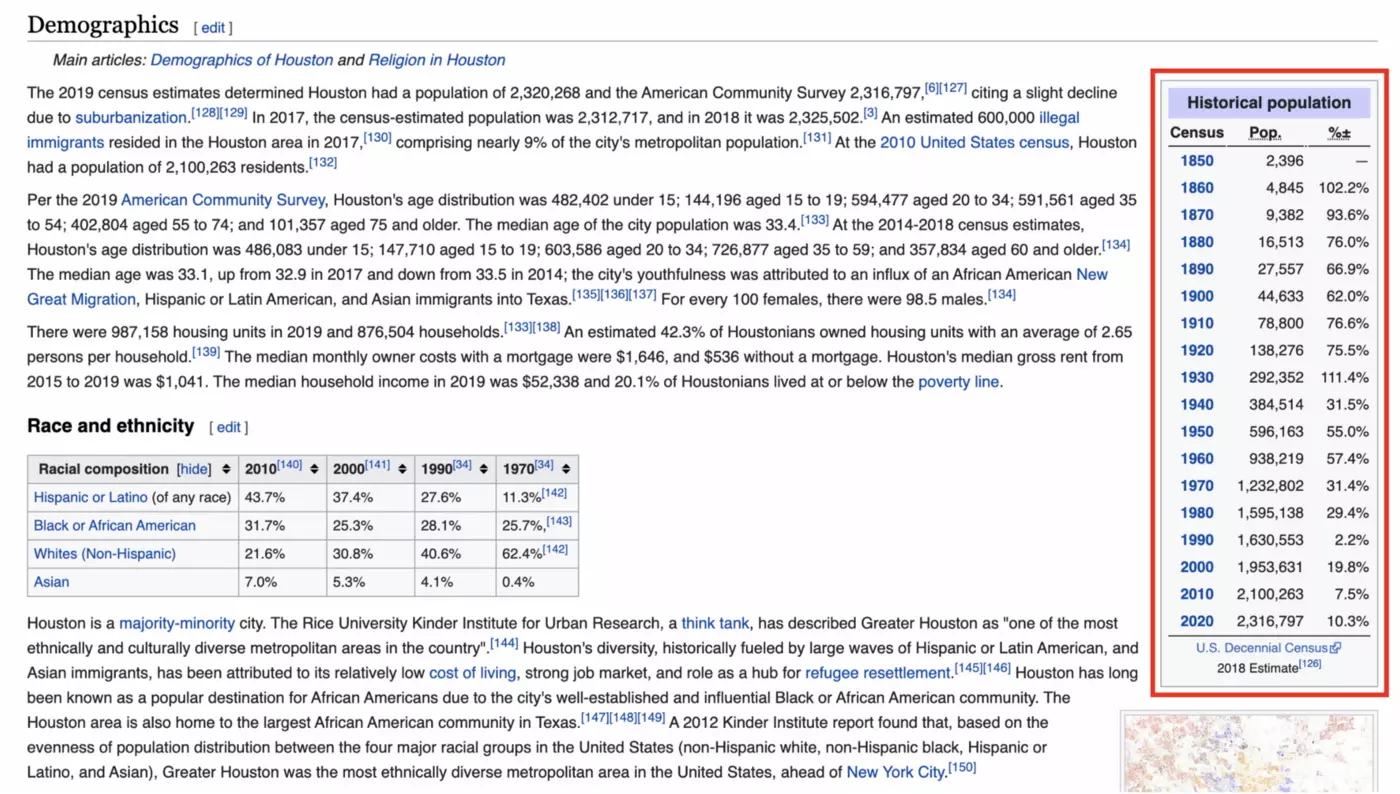
It’s a simple enough table, although we can already see that there may be some formatting to clean up when we bring this data into R.
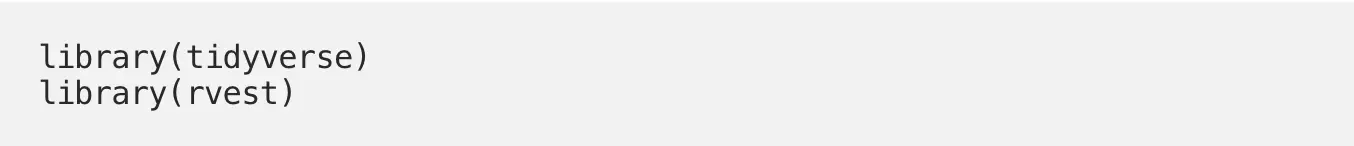
Once you’ve had a chance to look at the webpage, let’s get to the code. First, load the “tidyverse” and “rvest” packages. We’ll use the tidyverse to manipulate and clean the data that we scrape, as well as the rvest package to do the actual scraping:
Next, we need to give R the url for the webpage that we’re interested in:
![]()
We then use the read_html() function to translate this webpage to information that R can use, followed by the html_nodes() function to focus exclusively on the table objects contained within the webpage:
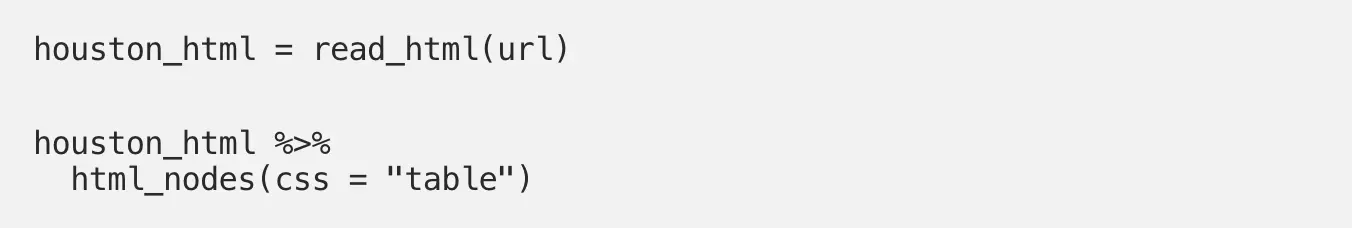
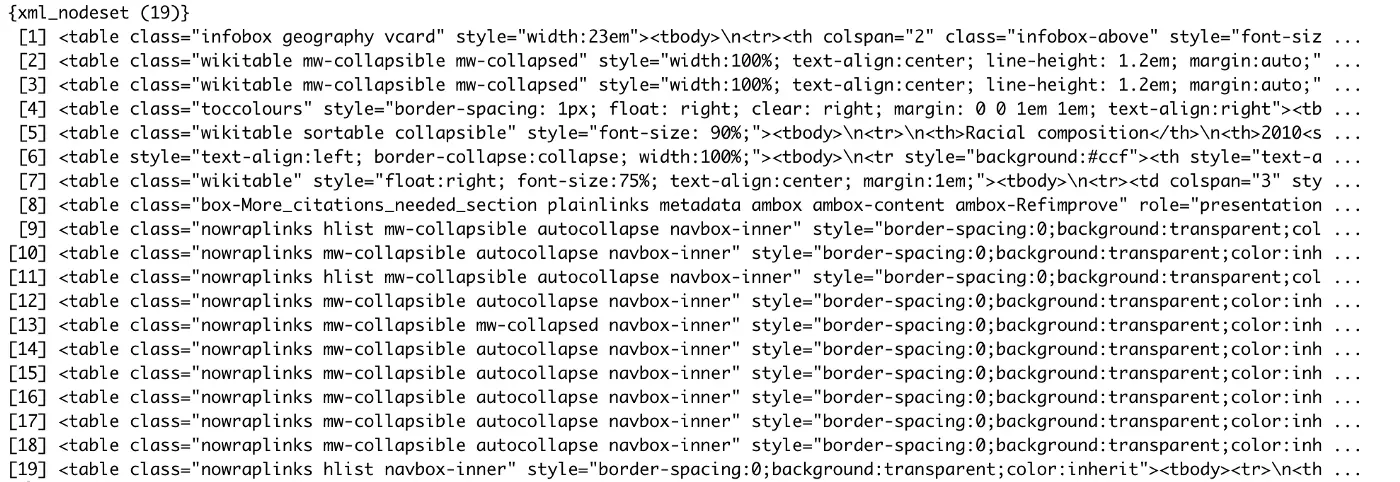
It looks like the Houston Wikipedia page contains 19 tables, although some of these class descriptions are more informative than others:
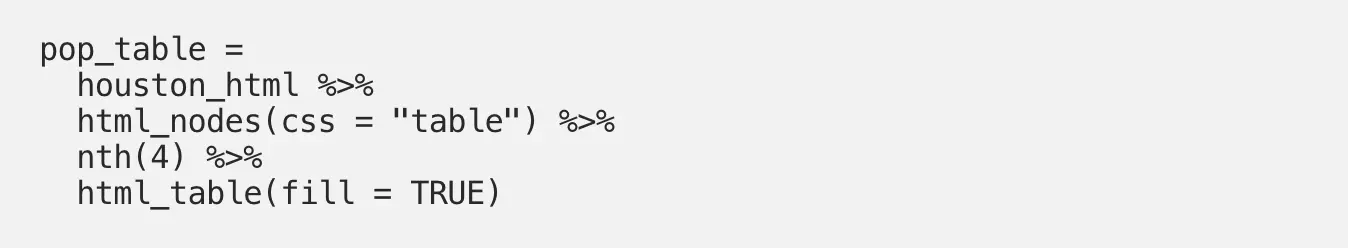
Next, we pull out our table of interest from these available tables. The nth() function specifies that we want the 4th table from the above list. Determining the right table to specify here may take some trial and error when there are multiple tables on a webpage. You can do your best to guess the correct number by looking at the webpage, as well as just viewing different tables until you see what you’re looking for:
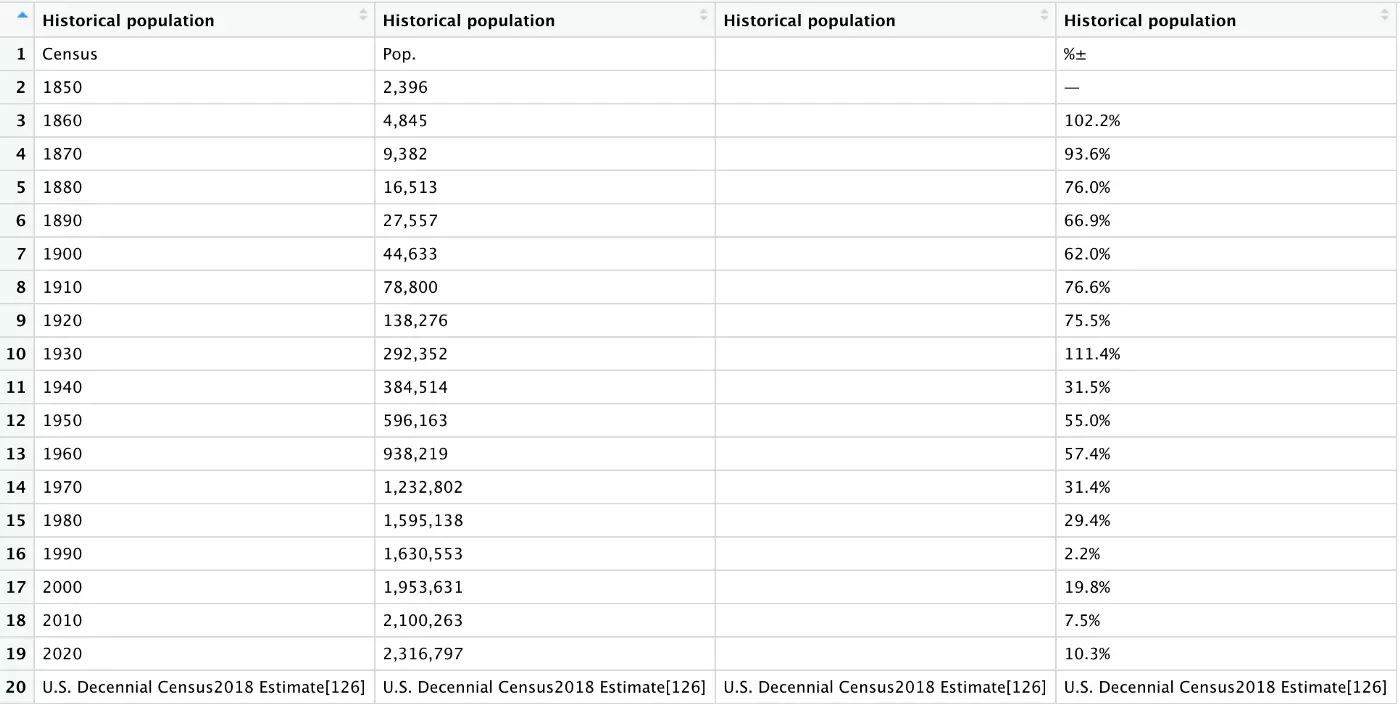
We get the following output, and the Wikipedia table is now in R! As often happens with web scraping, however, this table isn’t really usable yet. All four columns have the same name, the first and last rows don’t contain data, and there is an extra column in the middle of our data frame:
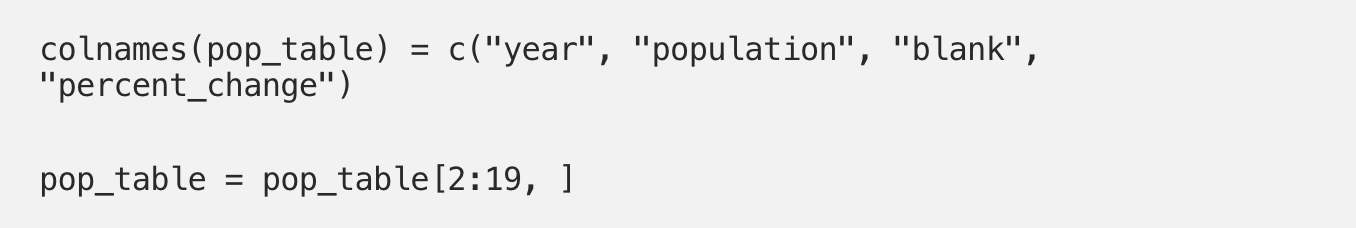
Let’s do some quick clean-up with this table to make it more usable. We can’t do much of anything before our columns have unique names, and we also need to restrict this table to its 2nd-19th rows:
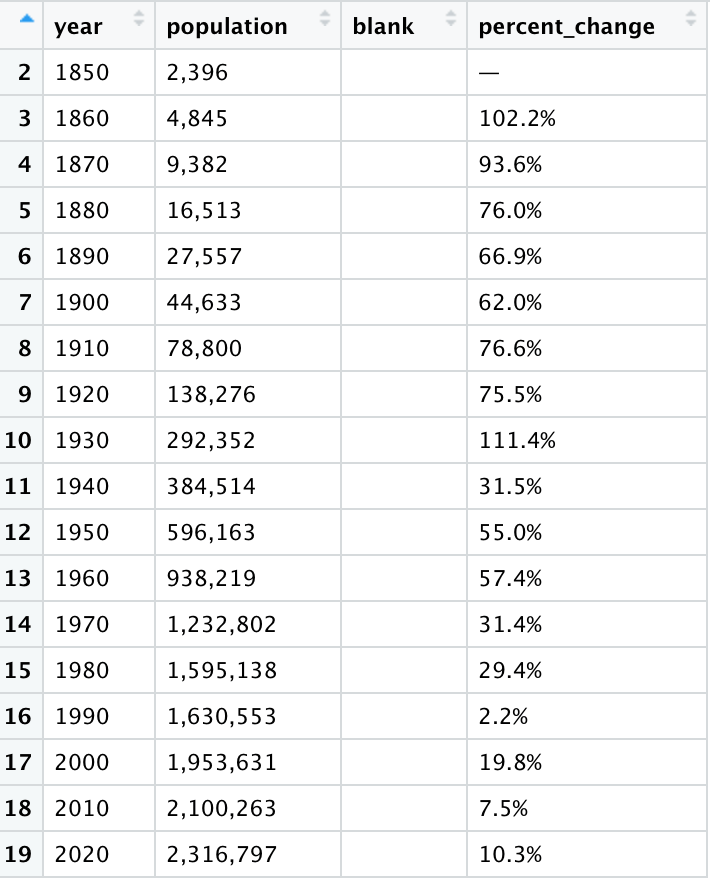
We’re not quite there yet, but the output is looking much better:
Let’s do some final cleaning. First, we’ll get rid of the blank column. All columns are also currently stored as character variables, whereas year should be a date and population and percent_change should be numeric. We remove unnecessary strings from the percent_change and population columns, then convert all columns to their appropriate formats:
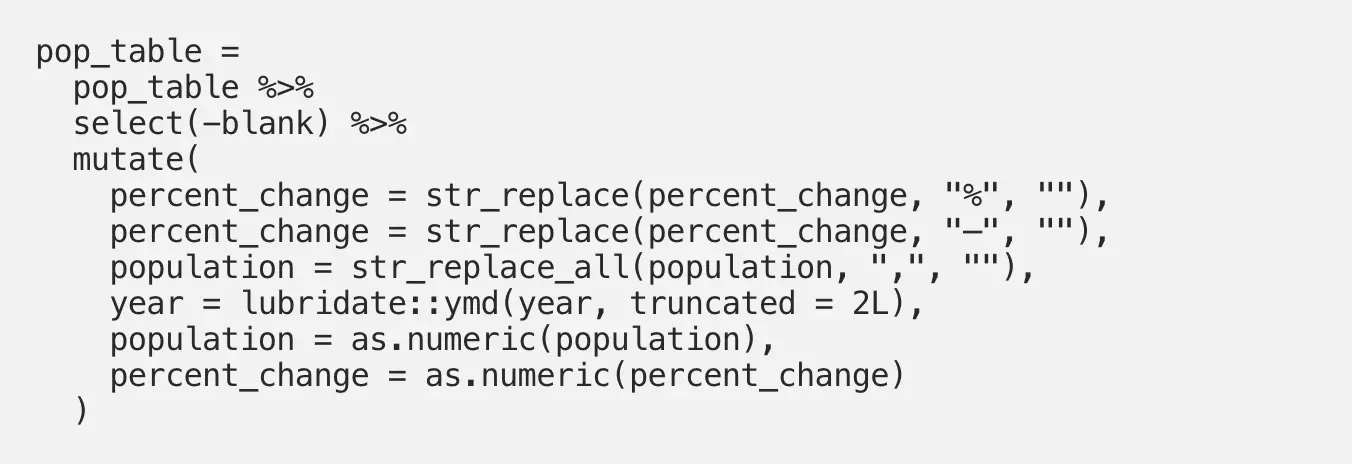
It’s as simple as that. Everything in the table now looks as we would expect it to:
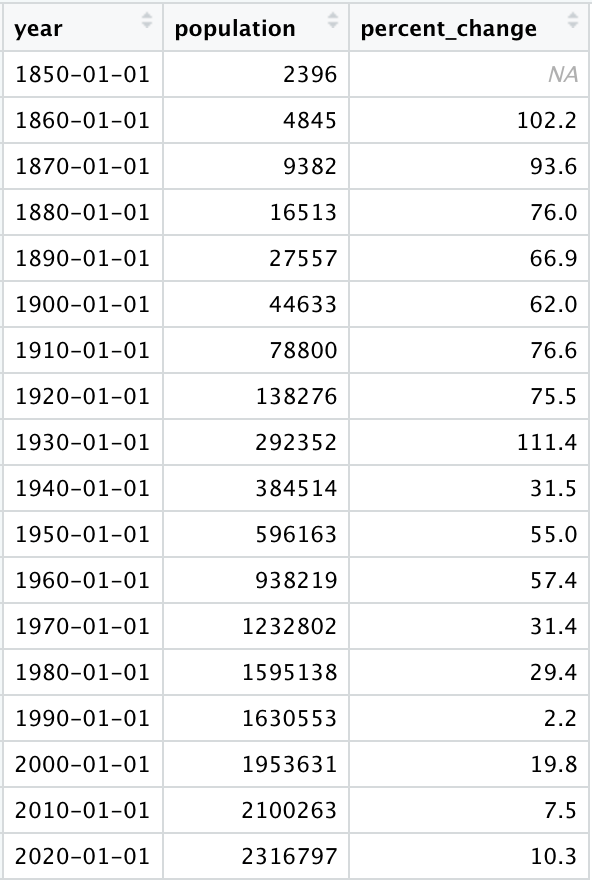
The population data is now fully usable and ready to be analyzed. Web scraping is a great tool for accessing a wide range of data sources, and is far preferable to manually copying values contained within online tables given its reproducibility and reduced likelihood for human error. The code contained in this article can additionally be built upon to scrape numerous tables at once, allowing for even greater efficiency and access to even more data.

Thanks for the clear explanation
Useful info
Good job Emily, nailed it with your explanation.
This is very inspirational and helpful for data scientists.
Emily is a data analyst working in psychiatric epidemiology in New York City. She is a suicide-prevention professional who is enthusiastic about taking a data-driven approach to the mental health field. Emily holds a Master of Public Health from Columbia University.
BBN Times connects decision makers to you. Experts in their fields, worth listening to, are the ones who write our articles. We believe these are the real commentators of the future. We quickly and accurately deliver serious information around the world. BBN Times provides its readers human expertise to find trusted answers by providing a platform and a voice to anyone willing to know more about the latest trends. Stay tuned, the revolution has begun.
Leave your comments
Post comment as a guest