One of the first things I wanted to do after receiving my COVID-19 vaccination was to visit a museum (with masks and social distancing, of course), and my first such visit was to The Museum of Fine Arts in Houston, Texas.
While milling about the galleries, I was immediately struckby one exhibit of Norwood Viviano’s work titled Cities: Departure and Deviation. The exhibit is, at its core, a visualization of time series data representing long-term changes in the populations of 24 cities. I’ve been focused on time series data at work for the last two years, so was intrigued that this artist had managed to visualize this data type so well that it literally belonged in a museum.
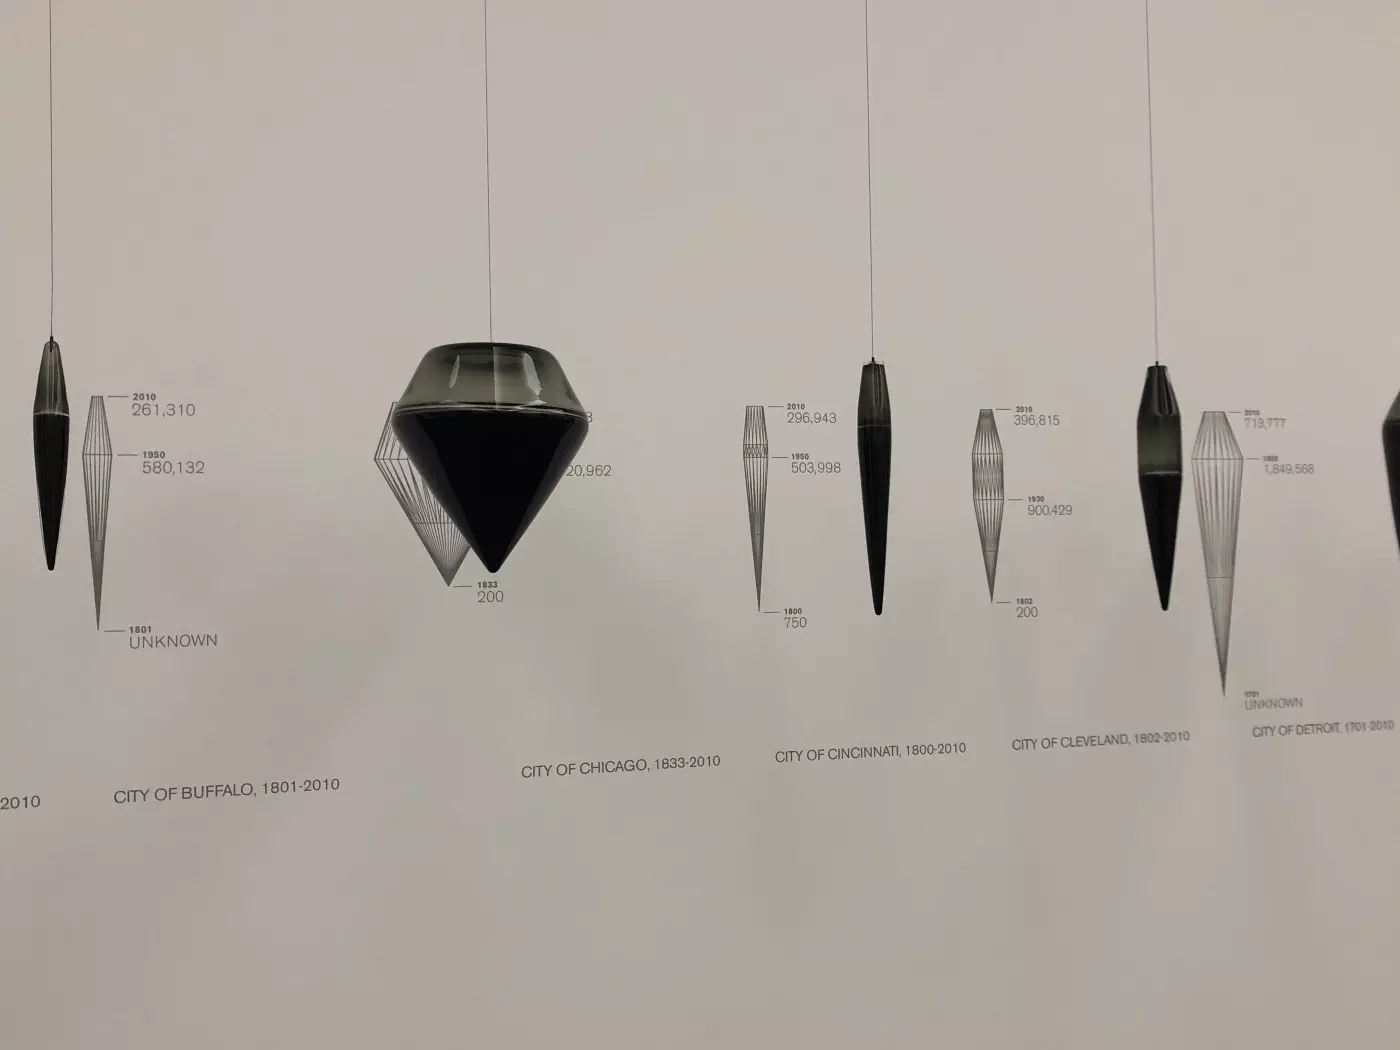
Image by author. Taken at the Museum of Fine Arts, Houston, Texas. Represents Norwood Viviano’s ‘Cities: Departure and Deviation.’
Each city is represented by its own glass-blown pendulum, the length of which represents time, the width of which represents population, and with changes in color that represent significant events. Population trends for each city are therefore captured in a unique 3D visualization reminiscent of a violin plot. Most pendulums contain 3 data points, resulting in fairly long, smooth shapes.
The exhibit effectively draws viewers in with its clean lines and modern greyscale before it even becomes apparent that you’re looking at a representation of real data. It’s an aspect of this visualization that I think is incredibly powerful — the audience of visitors to fine arts museums is broader than the audience that typically seeks out data visualizations, and museum-goers can be effectively drawn in and reached by this exhibit. Before you know it, you’re trying to think through these massive shifts in population trends and considering how the local industries must have changed to create the patterns you’re seeing. The visualization is minimalist, but its impact makes you want to seek out more information.
As a data person, this exhibit also got me thinking about what it left out — what decisions Viviano made and what their implications are. The average person does not spend their days thinking through the nuances of data, and has been shown to be overly quick to place trust in data and in the outputs of data-driven models. I’m inclined to believe that this is especially true in the case of a visualization such as Cities — the clean, greyscale appearance invites you to consider its representation as an absolute truth.
But as we data people know (or at least should know), data do not represent a single inherent truth. They may be cherrypicked and highlighted to tell particular stories, and even the best efforts at transparency can leave out important details or alternative angles. In the case of the Cities: Departure and Deviation exhibit, I couldn’t help but wonder what trends and events might be hidden by these clean glass lines.
I decided to look at the population trends in 10 of these cities, but to instead include all population data that I could find. I was curious how the patterns might differ from Viviano’s visualizations with this more granular level of detail, and what stories might have been left out in the one he chose to tell. To be explicitly clear, I in no way undertook this project to criticize Viviano’s work. To my knowledge, all data he represented is accurate and represented truthfully. Further, seeing as he blew each of these pieces in glass it’s hardly reasonable to have expected him to represent changes at 20 different time points. And even if he could have, I personally think that a more nuanced shape would have taken away from the striking nature of his pendulums. He is an artist, after all, and free to take such liberties with his work.
I do, however, think that looking under the hood of these data a bit is a useful exercise in reminding ourselves that data are not some all-powerful force of truth. Different conclusions can be reached and stories told from exactly the same data, depending on who is analyzing them and what they wish to say.
METHODS
I made a reasonable effort to find the same data used by Viviano as well as any other reliable population estimates. The data that I used comes overwhelmingly from the US Census, which is conducted every 10 years, although full data citations can be found at the end of this article. The ten cities I analyzed were chosen based upon my own general interest in their histories and not due to any expected findings in the data.
While at first glance Viviano’s pendulums do look like violin plots, actual violin plots were not useable here as they represent distribution (like a boxplot or histogram) and are not designed in their traditional 2D form to represent changes in scale over time. I therefore captured these trends with simple line graphs, although shaded the area underneath the line for easier visual comparison with Viviano’s pendulums. If you were to bisect a pendulum lengthwise and place it down on the cut side, you should see the trend approximated similarly to these line graphs. So, to compare these line graphs to the pendulums, it may be easiest to picture the mirror image of the shaded area as well as the graph itself.
THE CITIES
1. New York
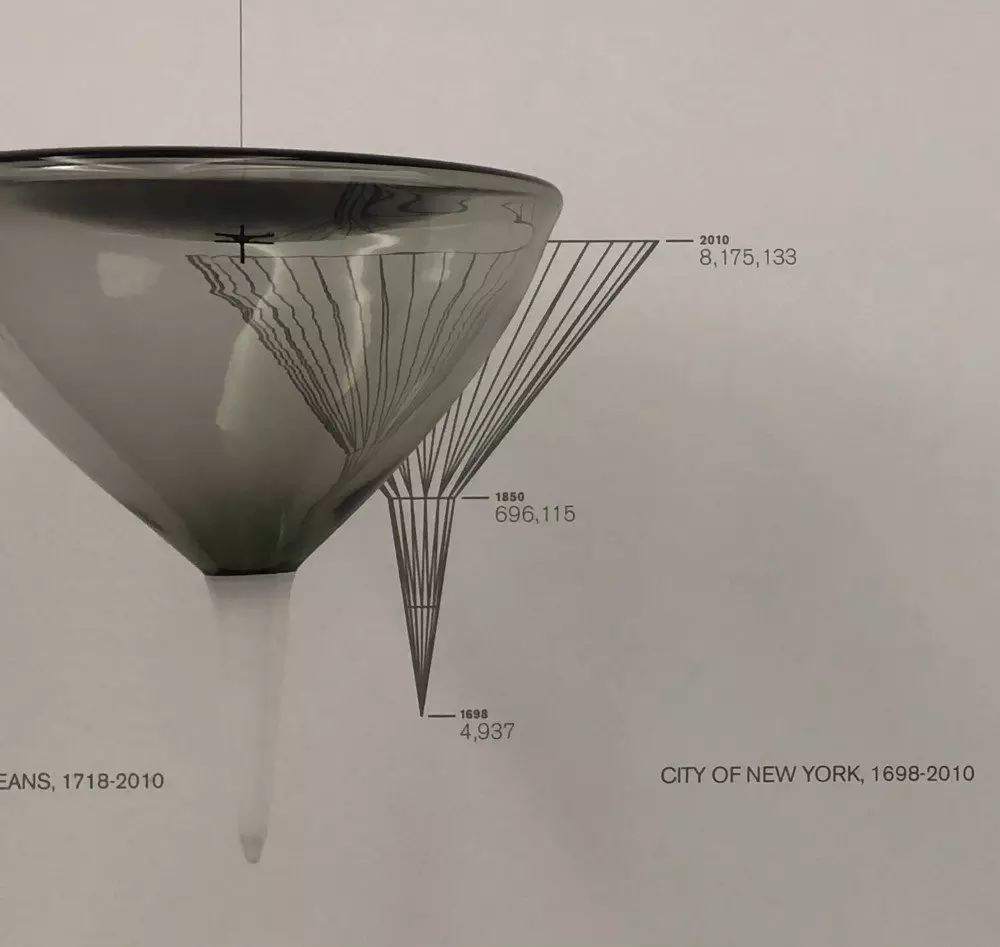
Image by author. Taken at the Museum of Fine Arts, Houston, Texas. Represents Norwood Viviano’s ‘Cities: Departure and Deviation.’
I was particularly interested in New York City’s population history given that this is the city I call home. Overall, I think that the story told by my line graph is quite in sync with that told by Viviano’s pendulum. However, by including no data points between 1850 and 2010, it appears from looking at the pendulum as though population growth began to change drastically in the year 1850. Looking at the line graph, however, it appears that this change actually began around 1890 (and further research indicates that New York City actually expanded its boundaries in 1898, which likely explains this increase). Additionally, there is an interesting dip in population in 1980 that is missed by the pendulum. That being said, I think that the 3D nature of Viviano’s pendulum captures the sheer scale of the population increase experienced by New York far more effectively than does the line graph.
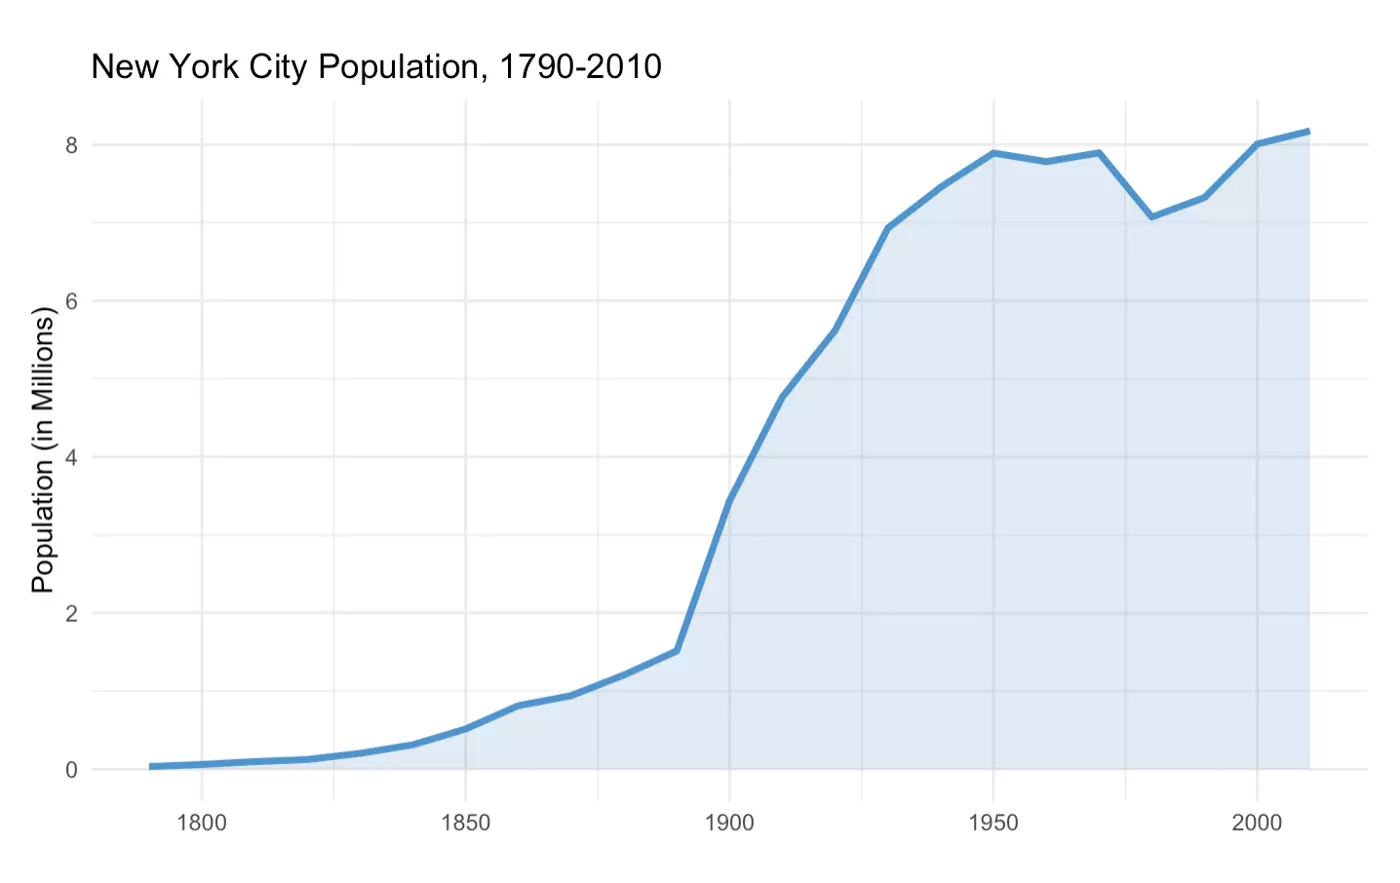
Image by author. See below for data sources.
2. Newark

Image by author. See below for data sources.
The pendulum representing Newark does a good job of highlighting the city’s continued growth until 1950 and subsequent decline in population until about 1990. Perhaps what this pendulum does best, however, is to put into perspective the sheer volume of New York City’s population. While the length of the these pendulums are quite comparable, the similarities between these (almost) neighboring cities end there. The massive bowl that represents New York’s recent population sizes absolutely dwarfs the thin tube that captures Newark’s population during the same decades. It is particularly striking to see Newark’s population decline given its juxtaposition with New York City’s pendulum, which so effectively highlights how another city just a half-hour’s drive away has been thriving consistently for decades.
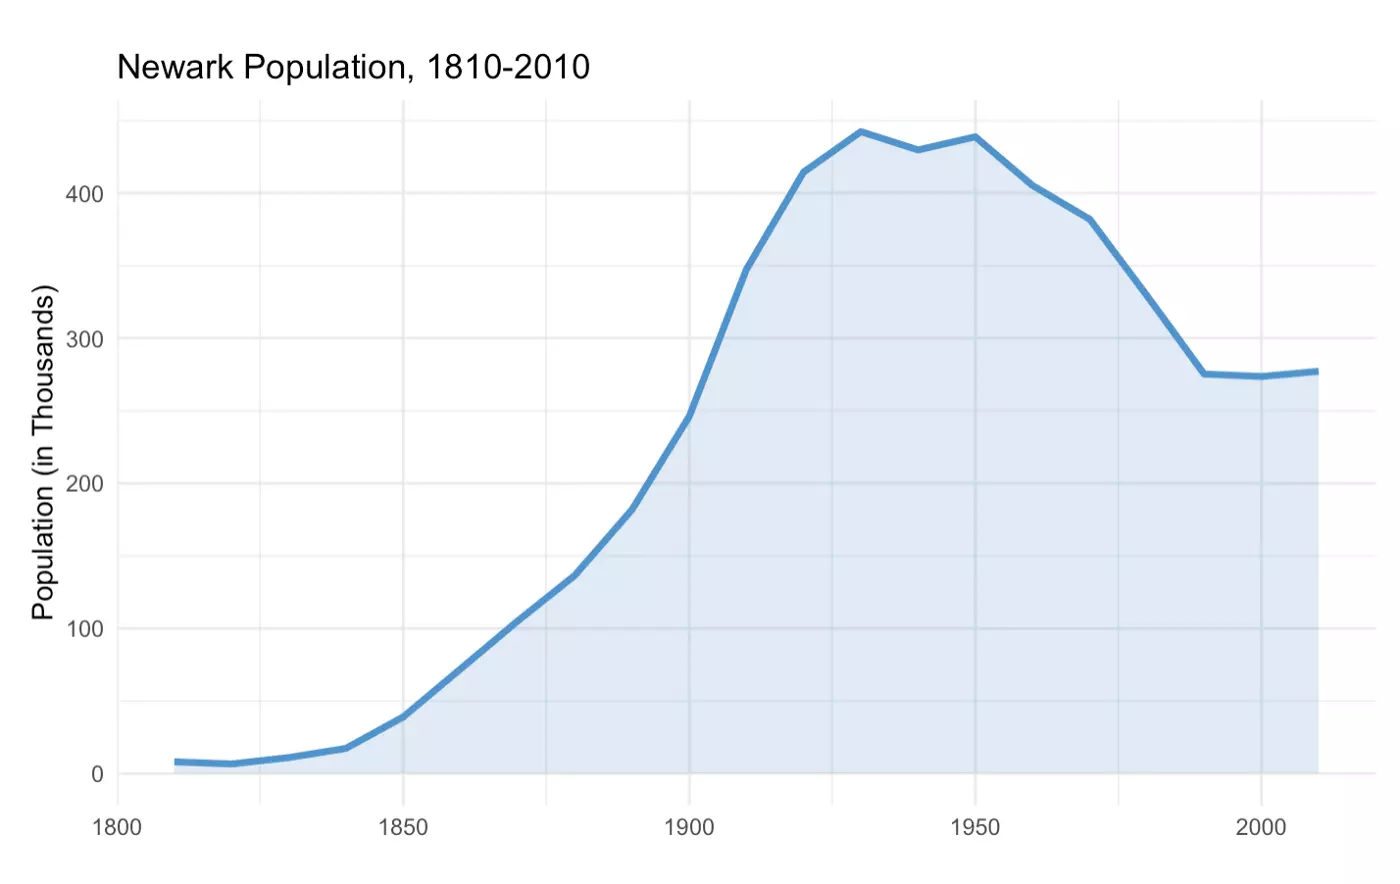
Image by author. See below for data sources.
3. Boston
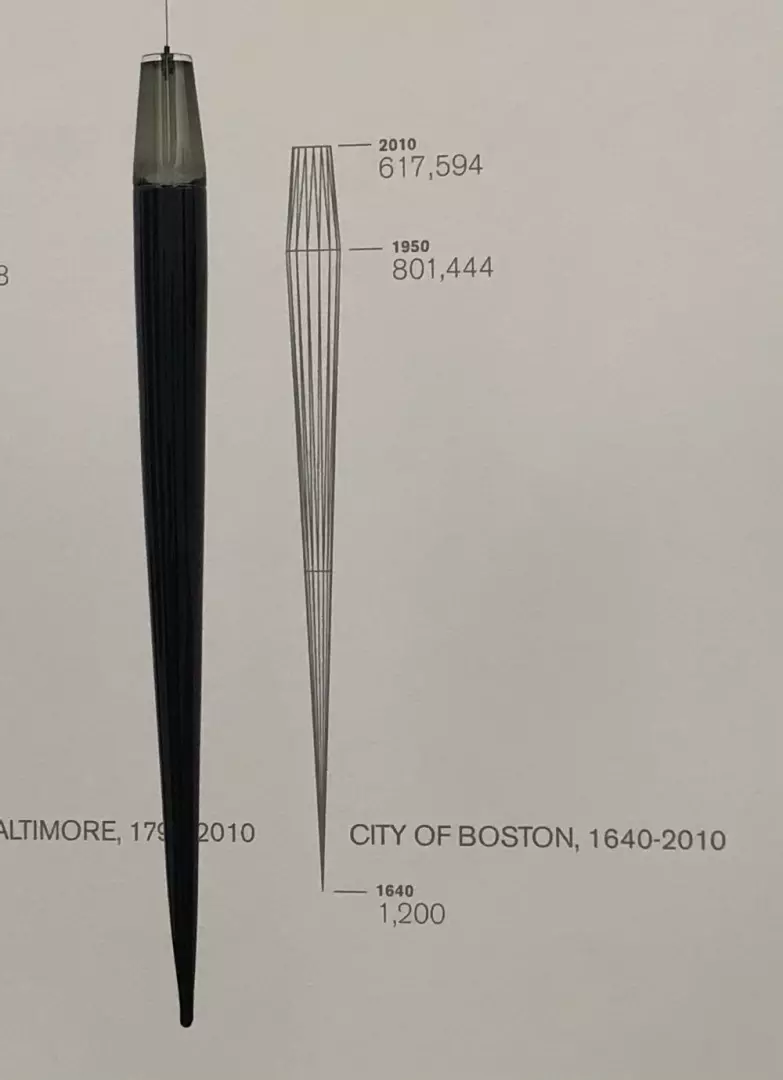
Image by author. Taken at the Museum of Fine Arts, Houston, Texas. Represents Norwood Viviano’s ‘Cities: Departure and Deviation.’
Yet again, I think that the exact timeline of population changes in Boston is a bit lost by only including these 3 data points. While the pendulum portrays steady, constant growth from 1640 to 1950, looking at the line graph it actually appears as though the rate of population growth increased significantly in the early 1800s. The sharp decline in population that began in 1950 is certainly highlighted well by the pendulum, but the small yet steady increase in population size that has been occurring since the late 1900s is missed completely. Clearly, Viviano was more interested in having the viewer think about factors that may have led to a decrease in Boston’s population since 1950, but I personally find it even more interesting to think about how and why the city has been able to reverse this population trend over recent decades.
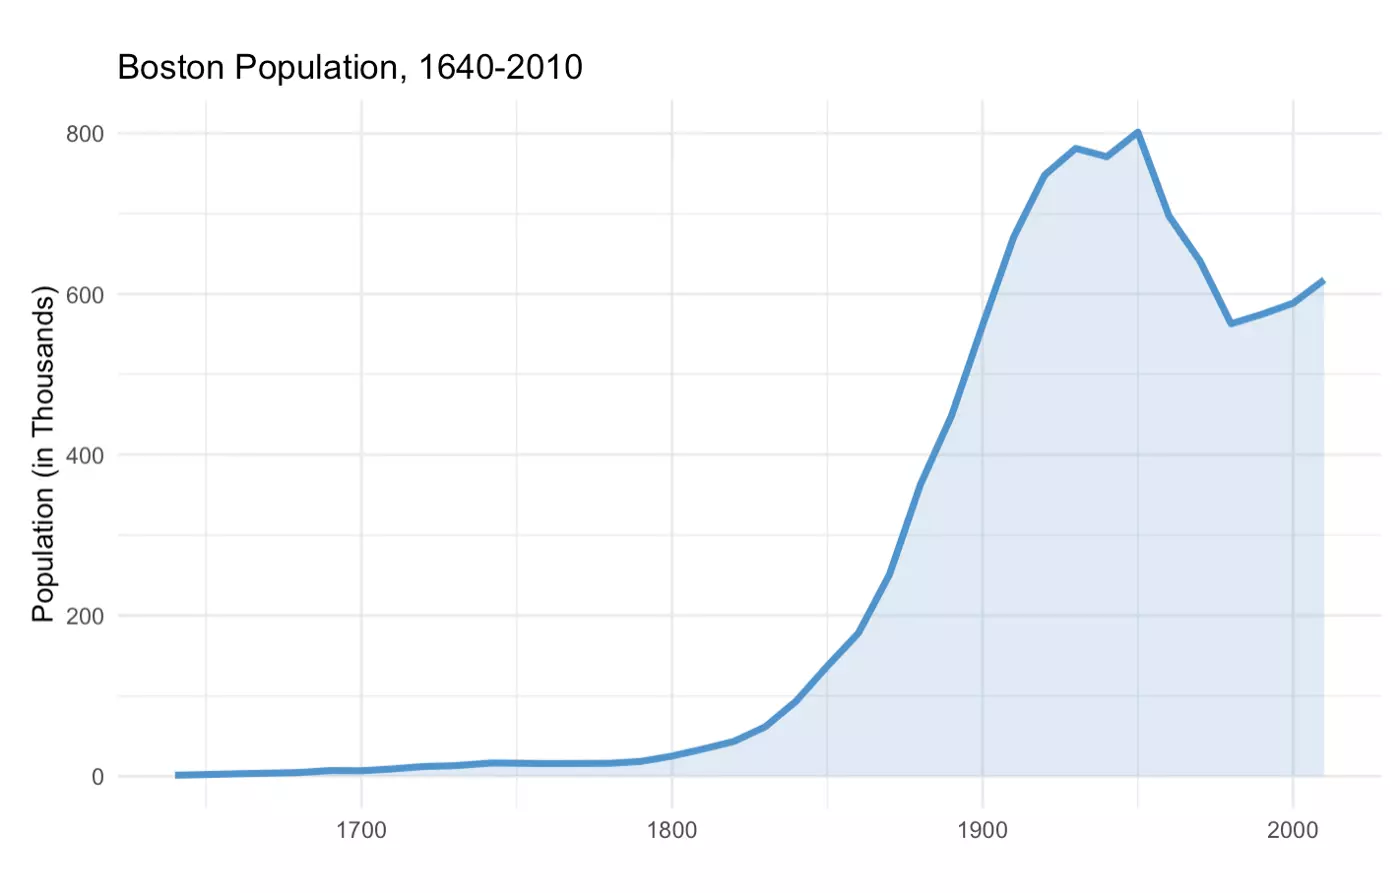
Image by author. See below for data sources.
4. Chicago
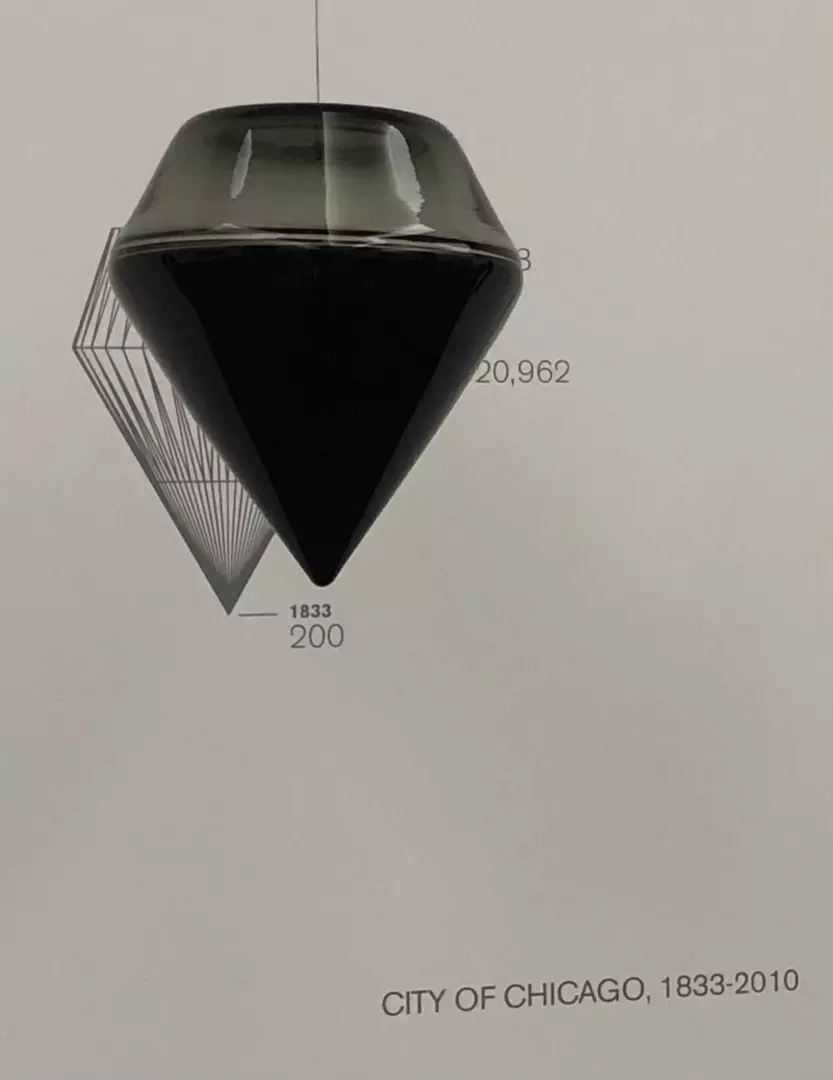
Image by author. Taken at the Museum of Fine Arts, Houston, Texas. Represents Norwood Viviano’s ‘Cities: Departure and Deviation.’
The pendulum representing Chicago’s population is particularly effective. It lines up well with the line graph, and in this case I don’t think any important trends are lost by the simplified design (perhaps other than a moderate increase in the population growth rate around 1880). In fact, I think that the simple, clean shape of the pendulum actually tells a clearer story of population change over time than does the line graph.
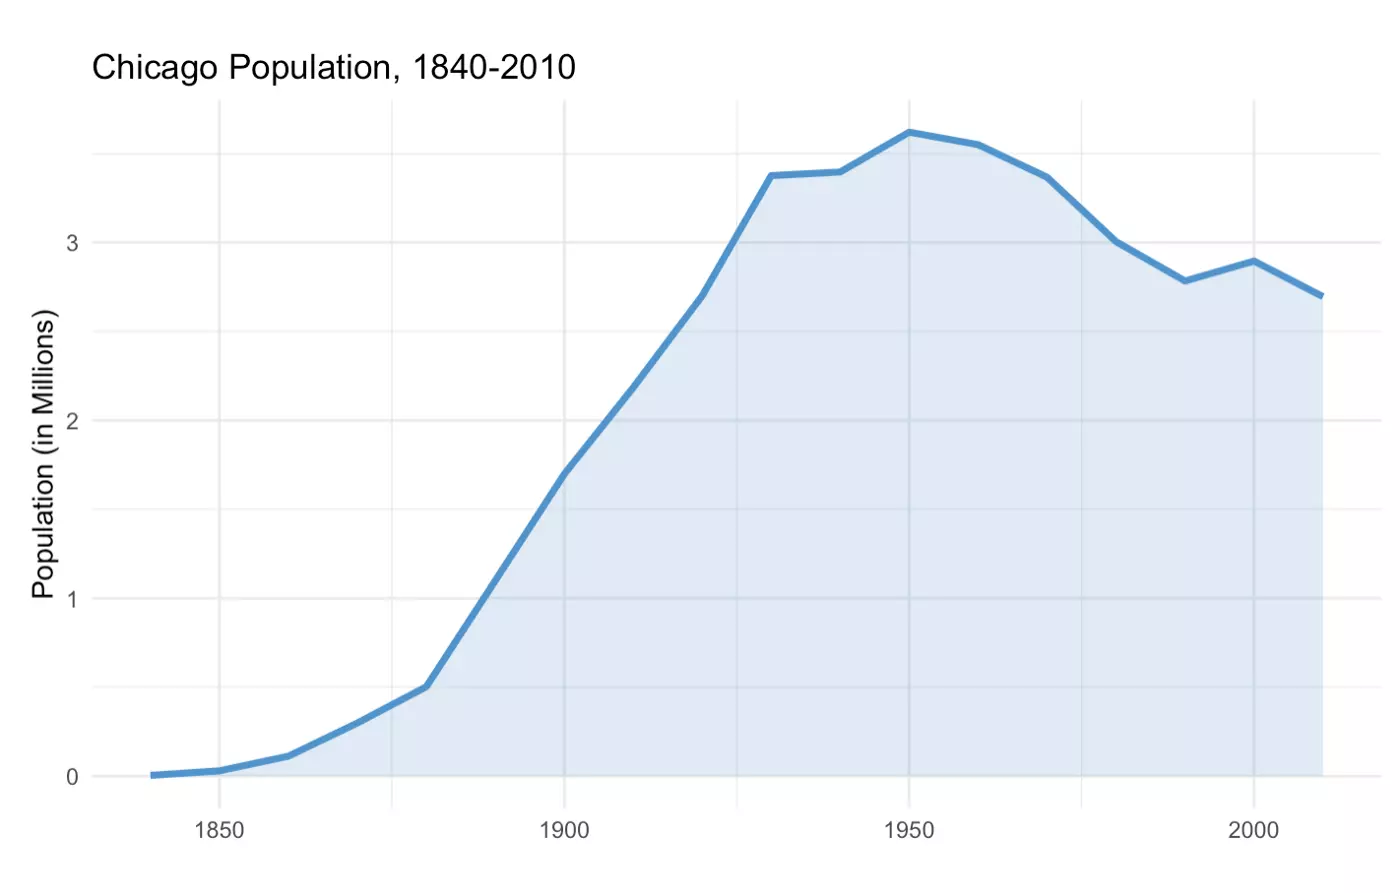
Image by author. See below for data sources.
5. Houston

Image by author. Taken at the Museum of Fine Arts, Houston, Texas. Represents Norwood Viviano’s ‘Cities: Departure and Deviation.’
The pendulum representing Houston’s population was constructed based upon just two data points, but it is still quite effective. As you can see from either the pendulum or the line graph, the population of Houston has been steadily increasing since 1850 without any significant plateaus or decreases in population size. The pendulum may in fact represent these data better than the line chart, despite its increased granularity. The cone shape of the pendulum gives a clear sense of the rapid population growth that occurred in Houston during the 1800s, but these increases aren’t apparent in the line chart. This is because even a 100% increase in population size that results in a new population in the low thousands is completely dwarfed given that the y-axis extends to 2 million.
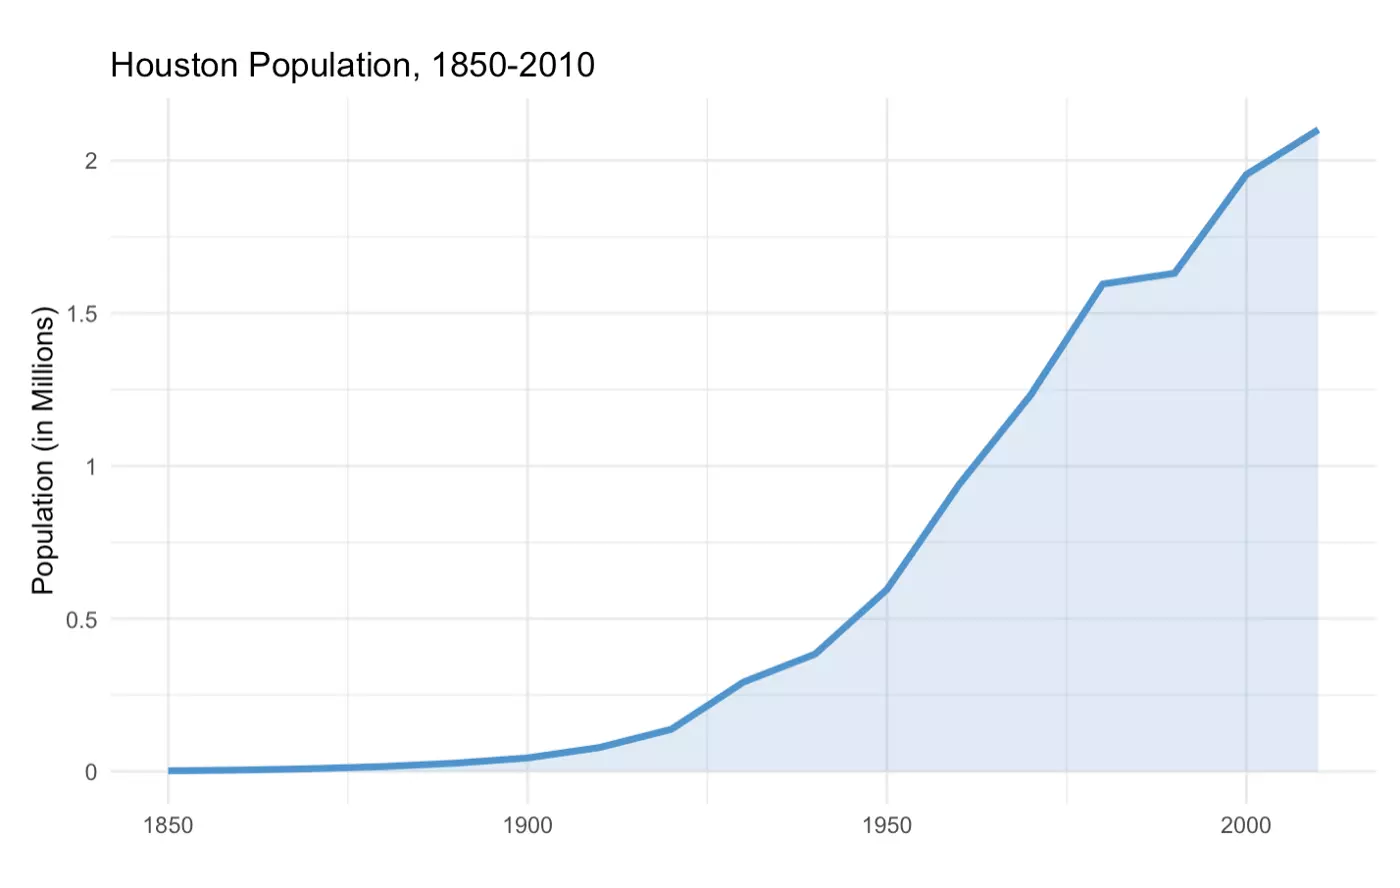
Image by author. See below for data sources.
6. Philadelphia
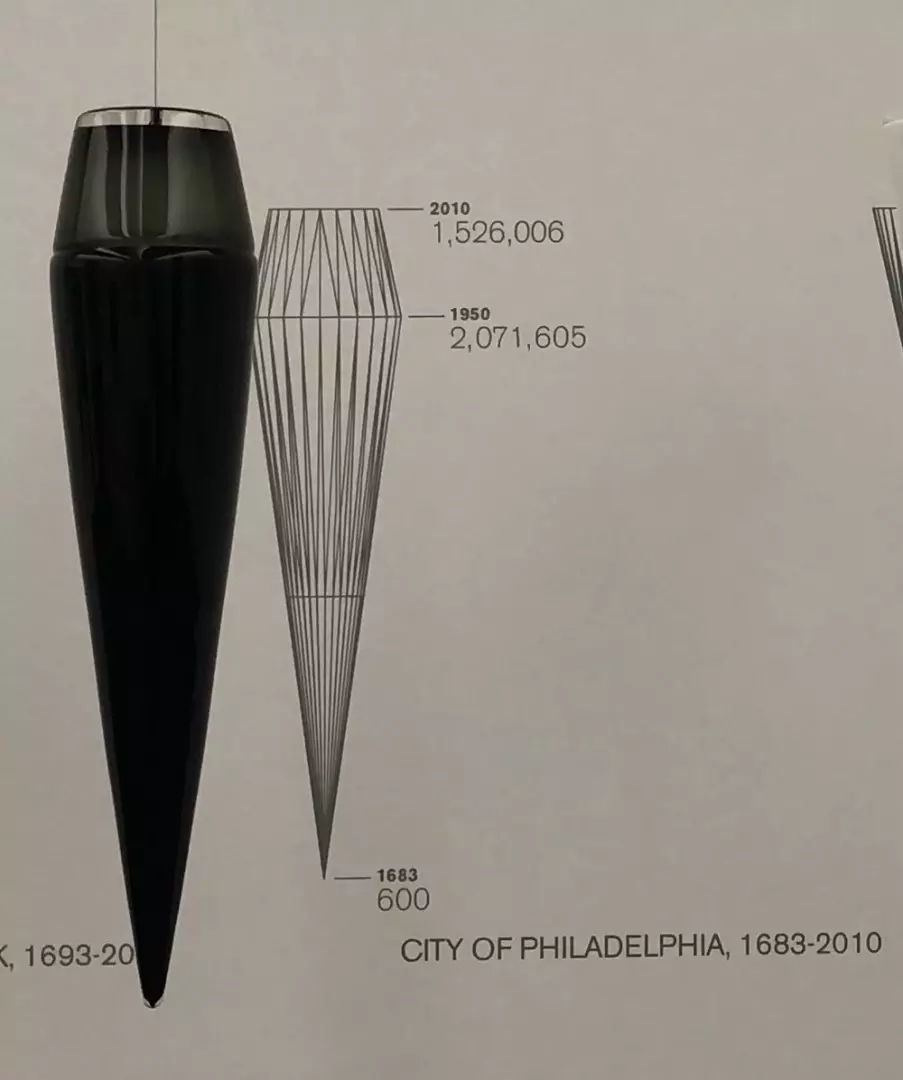
Image by author. Taken at the Museum of Fine Arts, Houston, Texas. Represents Norwood Viviano’s ‘Cities: Departure and Deviation.’
The pendulum representing Philadelphia completely obscures some significant change that occurred around 1850 (likely the 1854 Act of Consolidation, under which Philadelphia absorbed several surrounding areas). Looking at the line graph, it appears as though there are two periods of population growth leading up to 1950: one of moderate growth from 1683 to about 1850, and then one of much more rapid growth from 1850 onward. While the scale of population growth between 1683 and 1950 is captured well by the pendulum, this change doesn’t seem to have occurred as linearly as the smooth glass cone-shape would suggest. The population decline between 1950 and 2010, however, seems well represented and is highlighted quite effectively by the pendulum’s shape.
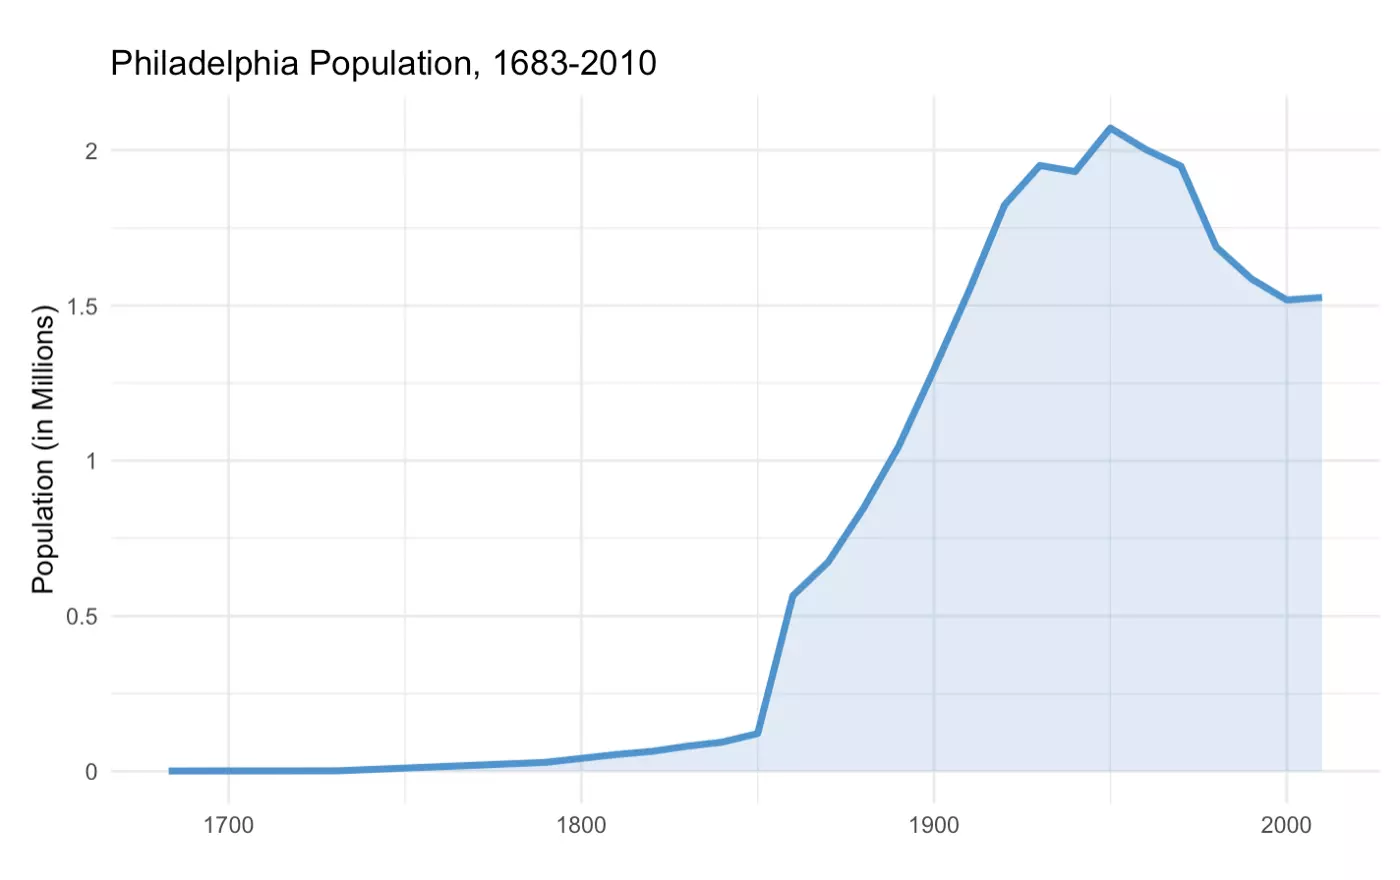
Image by author. See below for data sources.
7. Los Angeles
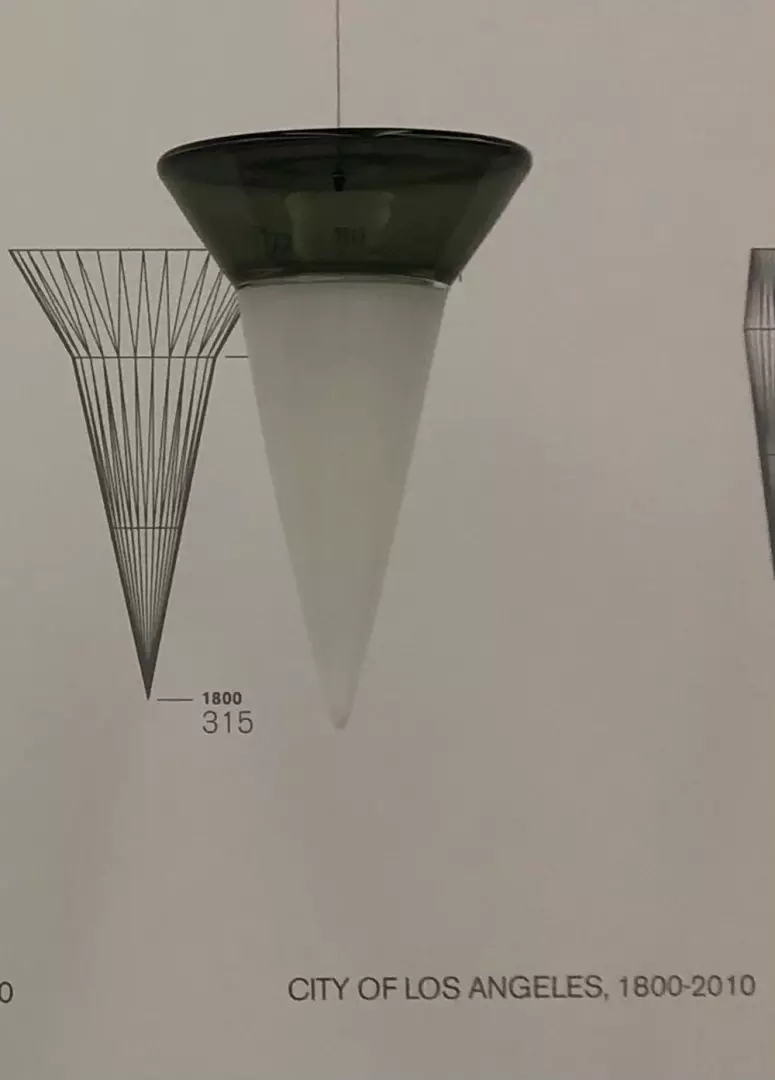
Image by author. Taken at the Museum of Fine Arts, Houston, Texas. Represents Norwood Viviano’s ‘Cities: Departure and Deviation.’
The pendulum representing Los Angeles’s population is another one that is generally quite effective, in this case showing the city’s steady and rapid growth since 1800s. I’m not quite sure what change Viviano is trying to capture, however, as the point where the white cone meets black (1950) is not reflected by a change in growth rate in the line graph. Instead, the line graph indicates a fairly consistent growth rate since at least about 1900.
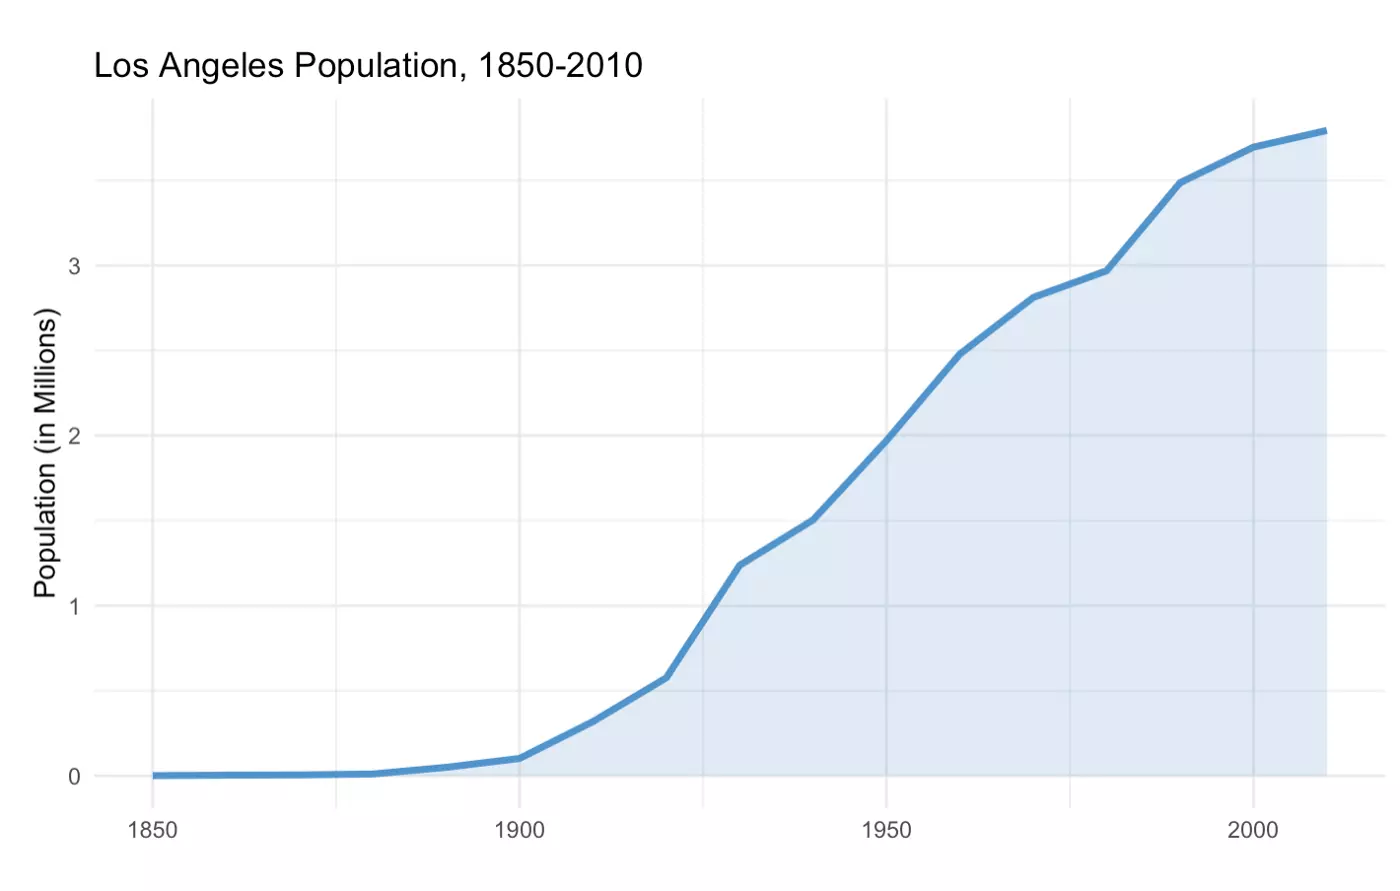
Image by author. See below for data sources.
8. Phoenix

Image by author. Taken at the Museum of Fine Arts, Houston, Texas. Represents Norwood Viviano’s ‘Cities: Departure and Deviation.’
It’s a similar story again with this pendulum: the overall consistent growth of the city is captured well, but based on the line graph it seems as though a break at 1950 might have provided a more thorough picture of the population changes over time in Phoenix.
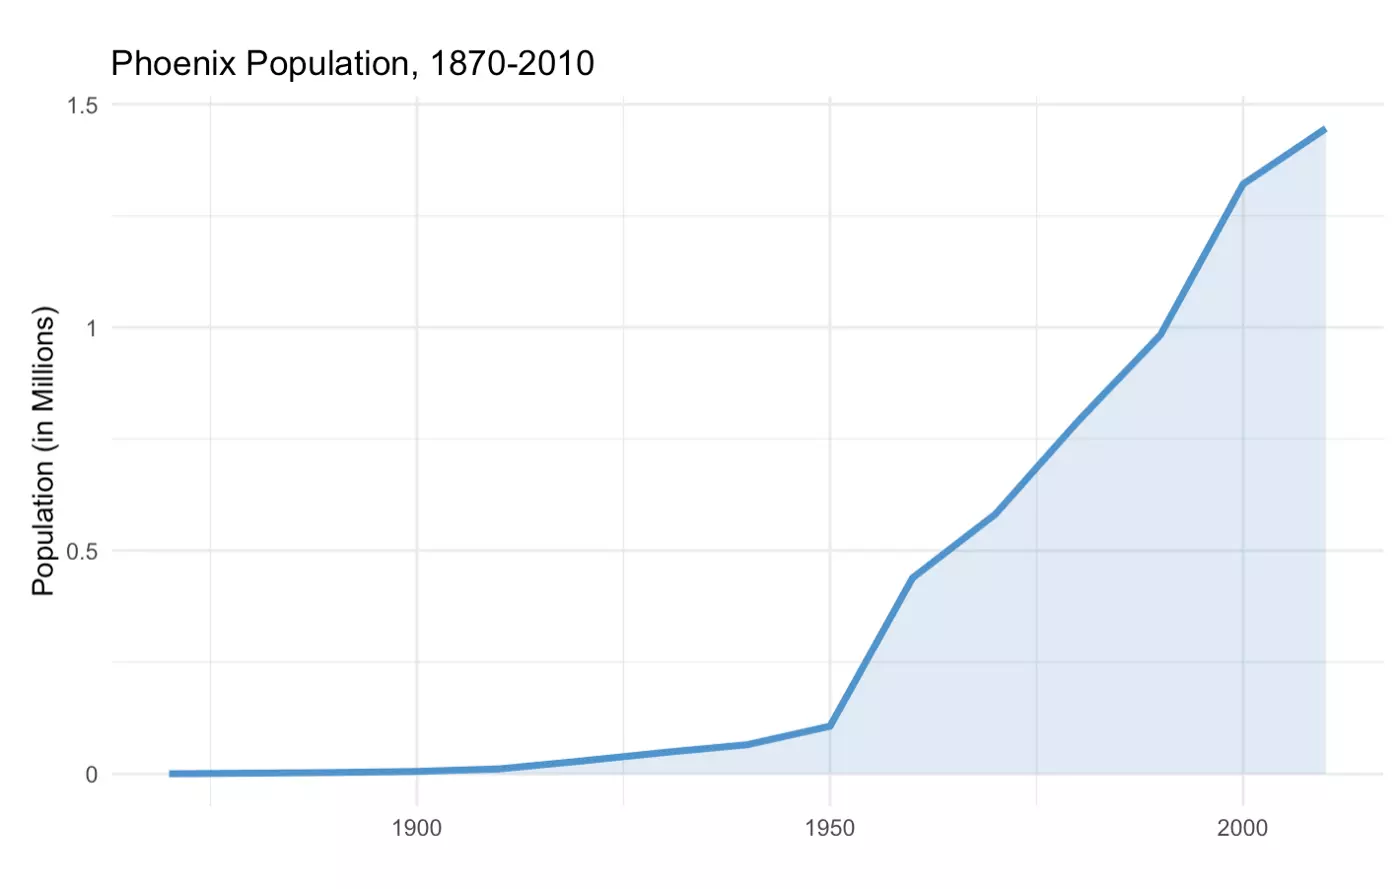
Image by author. See below for data sources.
9. San Francisco
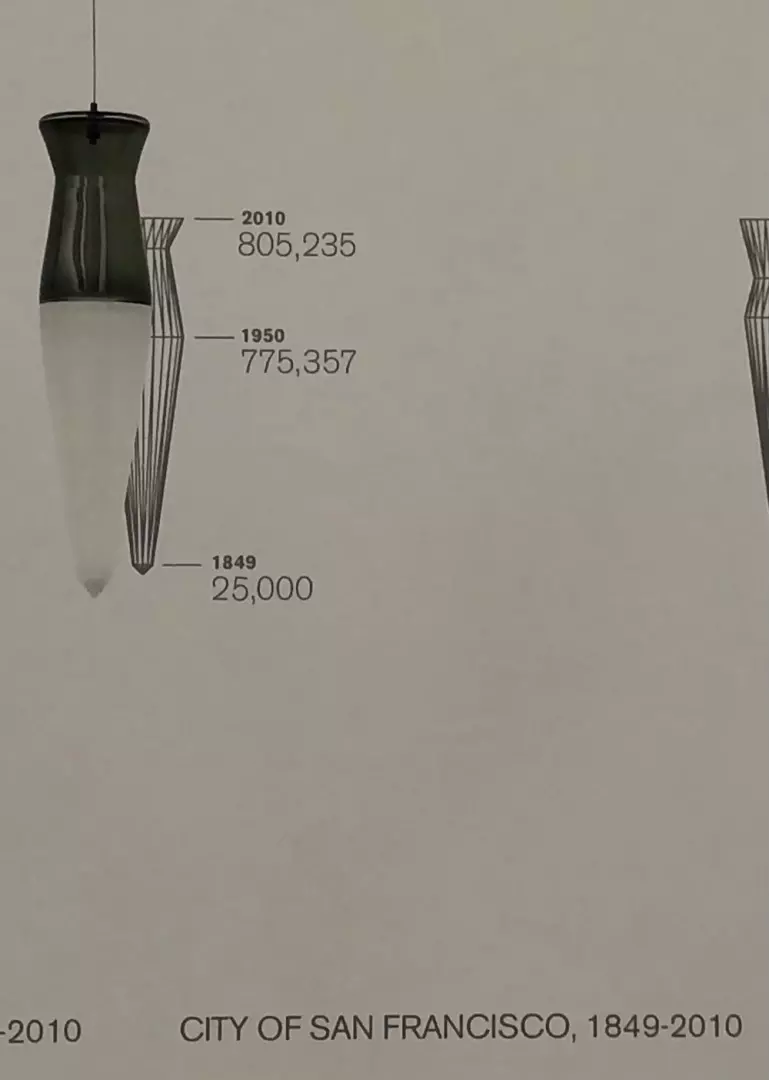
Image by author. Taken at the Museum of Fine Arts, Houston, Texas. Represents Norwood Viviano’s ‘Cities: Departure and Deviation.’
San Francisco is particularly interesting. Both the pendulum and the line chart tell a similar story of overall population growth with a short-lived decline in the latter half of the 1900s. Consistent as these two visualization types may be, they both gloss over what is probably the most interesting population change in this city’s history: the 2500% increase in population between 1848 and 1849 associated with the California Gold Rush. If you know what you’re looking for, you can certainly identify this change. The bottom of the pendulum has a tiny cone that represents this increase, and the first small but sharp segment of the line graph somewhat captures this change as well. In both visualizations, however, the scale of this sudden increase from 1,000 to 25,000 persons living in San Francisco is absolutely dwarfed by the scale necessary to represent more recent population levels. This important moment in the city’s population history only stood out to me in a table I saw while gathering population data, which calculated the percentage change between each available year of population data for San Francisco. The increase of 2500% was far higher than any other I’d seen while working on this project, and it therefore immediately captured my attention. As visually ineffective as tables can be for representing changes over time, in this case a simple table was able to draw attention to something that would be missed by most viewers of the pendulum or line graph.
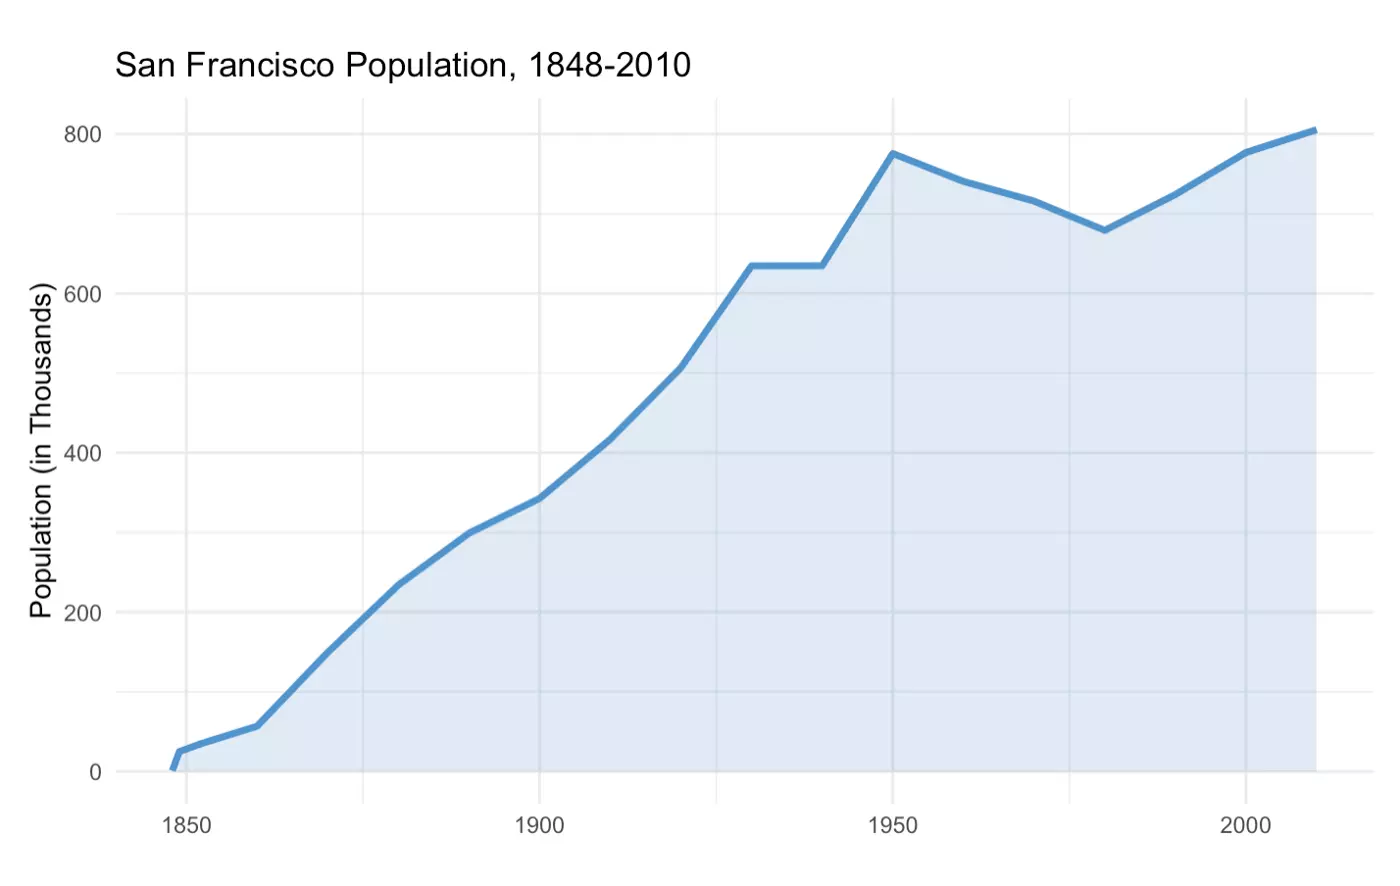
Image by author. See below for data sources.
10. Seattle
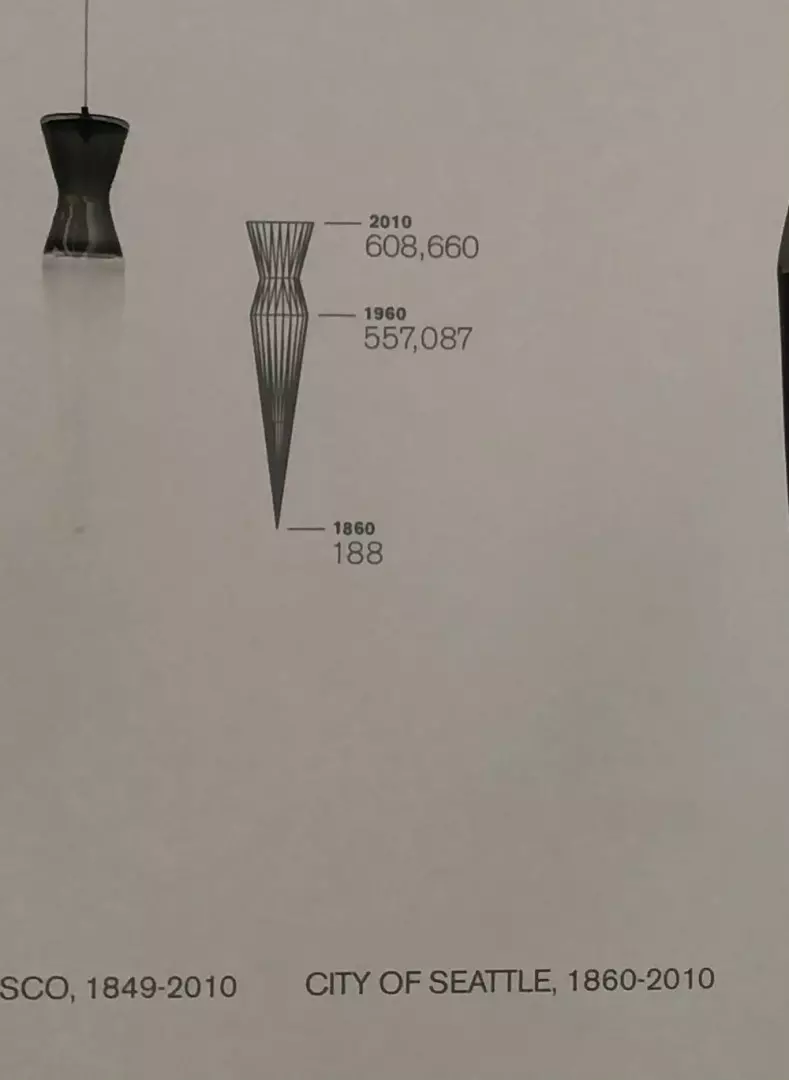
Image by author. Taken at the Museum of Fine Arts, Houston, Texas. Represents Norwood Viviano’s ‘Cities: Departure and Deviation.’
This final pendulum, representing the population of Seattle, is yet another that I find to be quite effective. While some of the nuances that are apparent in the line graph are lost, the clean lines and contrasting colors convey a very effective narrative of Seattle’s changing population over time.
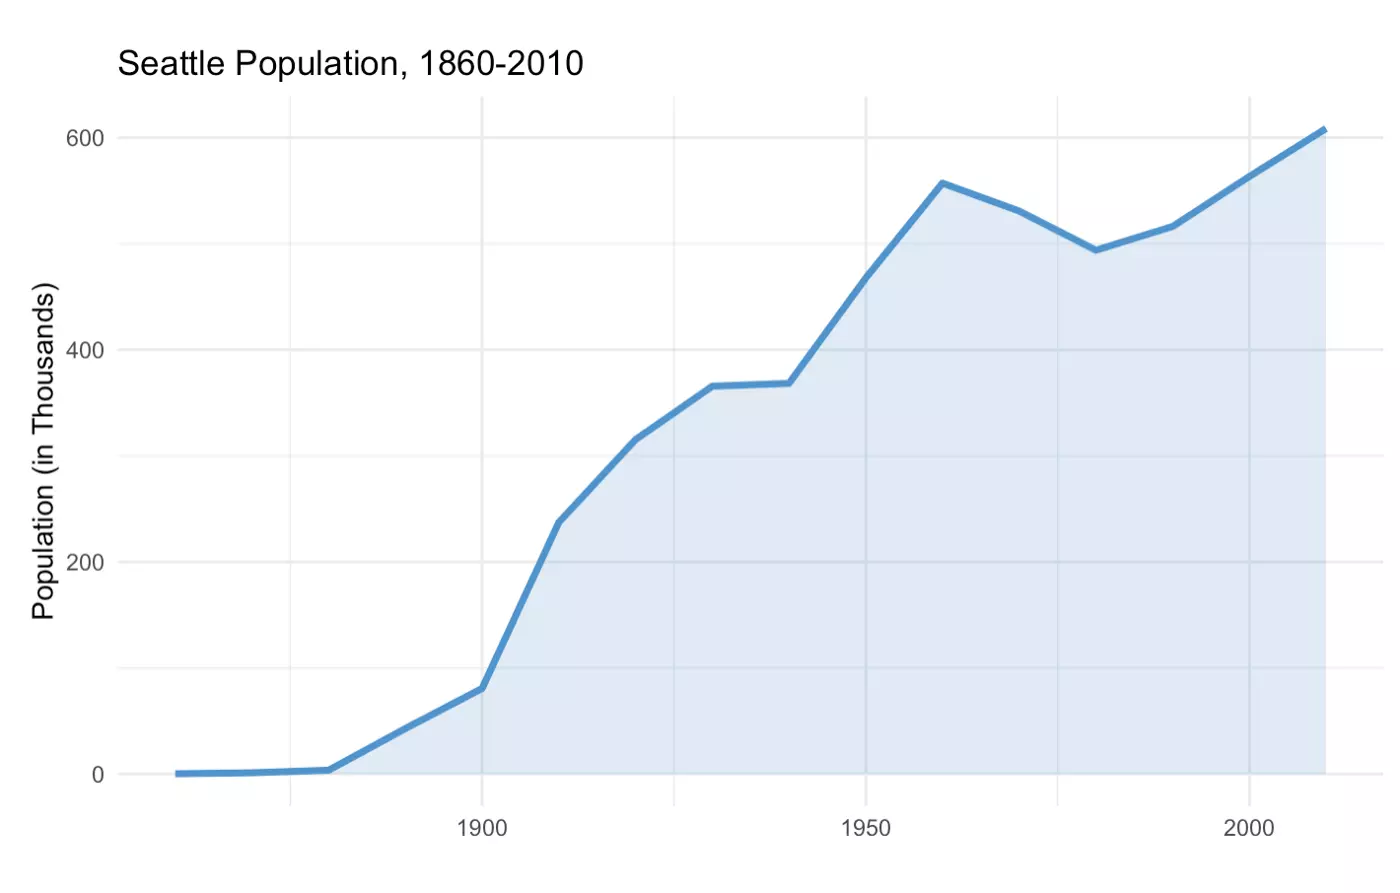
Image by author. See below for data sources.
IN CONCLUSION
In many ways, Viviano’s work is extremely effective. Major trends are communicated clearly, in some cases more so than in a traditional line chart.
The 3D nature of this exhibit is perhaps its greatest strength. Capturing population with volume gives the viewer a clear, tangible sense of scale that other visualization types can lack. The greatest benefit of the 3D approach, however, is the way in which it facilitates comparisons between the cities. Line graphs have the tendency to make everything look as though it’s on the same scale. Each line graph above varies in terms of the number of years included on the x-axis, and the y-axes vary so greatly that some have ticks in the thousands and others in the millions. While it would certainly be possible to use standardized axes for all of these plots, that would make them far more difficult to read while still being outshone by Viviano’s approach. It is incredibly easy to look at these pendulums side by side and get an immediate sense of which cities have been around the longest (or least have the greatest amount of available data) based upon the pendulum’s relative length, while also getting a clear perspective on the differences in scale between these cities (take New York and Newark again, for example). While the line graphs tend to make everything look as though it’s on the same scale, the pendulums actually are on the same scale.
That being said, no data visualization can be perfect. Some trends and important data points are missed by the pendulums, but as mentioned before the viewer may still accept these visualizations as representative of the a more complete story. Even more concerning is that a viewer who looks at either these pendulums or my line graphs without a critical eye will likely fail to consider the most significant problem with both kinds of visualizations: the quality of the data itself. Most data that I used came from the US Census, and from what I can tell Viviano used much of this data himself. The census is an incredibly valuable source of publicly available data and provides some of the best population estimates that we have, but it is also notoriously problematic. Many populations are particularly likely to be undercounted in census counts, and therefore in the above visualizations, including children, individuals who rent instead of own homes, undocumented persons, and Native Americans living on reservations.
I commend Viviano for visualizing data in a novel, creative way likely to reach a broad audience. But his work also reminds me of the importance of continuing to talk about the complexities of data, and the absolute need to question what other stories may be hidden within a given set of data as well as the validity of the data itself.


Leave your comments
Post comment as a guest