Comments
- No comments found

Traditionally, the United States has relied on government surveys to gather essential data on employment, income, and other critical aspects of the economy.
These surveys typically involve either calling people on the phone or sending them forms, or sometimes a combination of both methods.
The responses collected through these surveys are then carefully tallied and analyzed to provide valuable insights into the state of the economy and family income trends.
There are obviously problems with this approach: for example, if you are receiving government benefits, but also have a side job to bring in some extra cash, are you likely to be honest when someone from the government asks if you are employed? However, one could at least argue that if the surveys are carried out in (roughly) the same way over time, then these kinds of biases would be (roughly) the same over time.
But the rate at which people are willing to answer surveys has dropped substantially in recent years. The National Academy of Sciences has published a couple of recent reports on what might be done: Toward a 21st Century National Data Infrastructure: Mobilizing Information for the Common Good (2023) describes the importance of reliable and public government data to the operation of the economy, the decline in survey response rates, how certain data series are being gradually discontinued as a result; in a companion report, Toward a 21st Century National Data Infrastructure: Enhancing Survey Programs by Using Multiple Data Sources (2023) launches a discussion of what alternative sources of public data might be plausible.
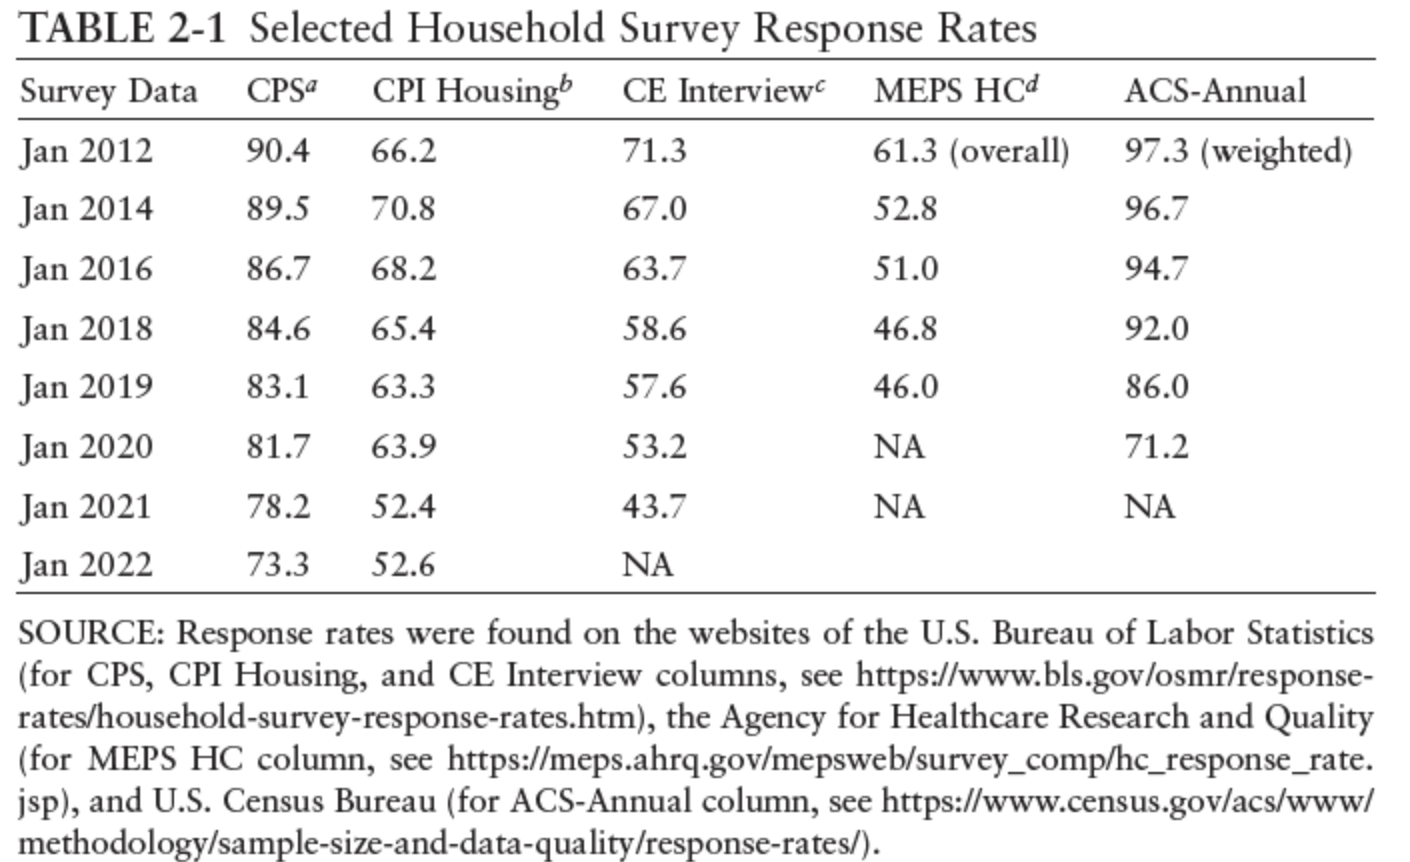
Here’s a table showing the problem of declining response rates for households in the last decade–especially since the pandemic hit in 2020. The Current Population Survey (CPS) provides the core data on employment, earnings, and the workforce. It had a 90% response rate a decade ago, now down to 73%. The Consumer Price Index (CPI) Housing survey collects data on prices for rental housing and also estimates the “owner equivalent of rent.” These numbers feed into the estimates of overall inflation. This survey had a 70% response rate in 2014, but was down to 52% by 2022. The Current Expenditure Survey (CE) collects data on how households are spending their money, and among other purposes, it is used to weight observed price changes and develop the inflation rate. It’s down to a 43% response rate. The Medical Expenditure Panel Survey collects data from households and health care providers. families and individuals, their medical providers. It was down to a 46% response rate before the pandemic. The American Community Survey (ACS) collects annual data on a wide array of social, economic, housing, and demographic factors down to the community level. Its response rate was 97% a decade ago, and it was down to 71% before the pandemic hit.
When the survey response rates drop this dramatically, the reliability of the information drops, too. The survey response problems are severe enough that a number of specialized surveys have been ended, or in some cases suspended for a time. The NAS report notes (citations omitted):
The increasing costs of obtaining participation and flat or declining budgets have led to the elimination, or threat of elimination, of multiple important programs and surveys. … For example, in 1996, the National Vital Statistics System, part of the National Center for Health Statistics, suspended the collection of detailed national records-based data on marriages and divorces. In 2008, after publishing fourth-quarter 2007 estimates, the U.S. Census Bureau terminated its quarterly survey measuring residential alterations, improvements, and repairs. In the absence of official statistics, private sector estimates of the size of the home-improvement marketplace vary widely. For 2020, private sector estimates ranged from $150 billion (Statista, 2022) to $325–333 billion. The elimination of the U.S. Bureau of Labor Statistics (BLS) Mass Layoff Statistics program, a BLS-state cooperative program, resulted in the loss of a standardized approach across states to identify, describe, and track the effects of major job losses. With the loss of the Information & Communication Technology Survey, there are no longer official annual estimates of information, communication, and technology equipment or software purchases—a huge and growing market. According to a report commissioned by the Census Project, a nonpartisan advocacy group, the future of the ACS is threatened. Experts argued that the ACS, a survey central to the nation’s data infrastructure, needs an additional $100–300 million in funding to address current limitations and introduce much-needed enhancements.
So you want to know about estimates of IT and software spending in the US economy? Might be important! But the survey ended. Want to study how people are spending money on fixing up their houses, perhaps rather than moving, in this era of work-from-home and higher interest rates? Might be important. But the survey ended. Want to study patterns of marriage and divorce, both the effects on those involved and also the effects on care-giving for children and elderly parents? Might be important. But the data isn’t being collected by the federal government.
Part of the issue here is just that the government needs to spend more on collecting statistics. As I’ve noted in the past, total federal spending on collecting statistics is 0.18% of the federal budge - that’s not 18%, but less than one-fifth of 1%. It would be a sensible social investment to spend more here: say, an additional 0.1% of federal spending. But as the traditional survey-based methods of collecting data become increasingly unreliable, the statistical base also needs to shift to alternative sources of data.
This shift is already happening. Researchers are making much wider use of “administrative” data that is collected for other purposes: for example, being able to look at tax return data to measure income, or Social Security data to measure wages, may be more accurate than relying on household surveys. The obvious questions here are how to limit the use of administrative data so that it shows overall patterns but doesn’t invade the privacy of individuals. Also, because administrative data was not designed to be used for research purposes, it needs to be handled with care. But these hurdles are surmountable.
The second NAS volume launches a discussion of expanding the sources of publicly-available government data in other ways. In some cases, this can mean being open to finding ways of linking existing data. For example, the NAS report gives the example that there was data from the US Department of Housing and Urban Development about what housing had greater or lower risks of lead exposure for children. There was data from the National Health and Nutrition Examination Survey (NHANES) on levels of lead in children’s blood. But there was no link between the two: that is, it wasn’t possible to determine how living in a place with less exposure to lead affected the level of lead in the bloodstreams of children. However, it was possible to link records of actual households, both where they lived and the levels of lead in children’s blood–and to do so with an anonymous numbering system so that the information of any specific household was not available to the researchers.
But the report also considers a wide array of other data. Along with asking households about what they buy, for example, perhaps actual sales records from grocery stores or retail outlets could help. In learning about, say, health or car or home insurance, perhaps actual data from insurance companies could help. For issues like environmental measurement and agriculture, satellite images may help. Location data from cell phones and health data from fitness trackers might be useful. Data might be scraped from the web, or from social media, or crowd-sourced.
It’s easy to think of ways in which these alternative sources of data could go astray, either in accuracy or in revealing personal information. Also, government data needs to be available at regular intervals, broadly representative, and comparable over time, not just a one-time data dump. But it’s also obvious that the publicly-available information is widely useful, and that current methods of collecting public data are in the process of going astray themselves.
Timothy Taylor is an American economist. He is managing editor of the Journal of Economic Perspectives, a quarterly academic journal produced at Macalester College and published by the American Economic Association. Taylor received his Bachelor of Arts degree from Haverford College and a master's degree in economics from Stanford University. At Stanford, he was winner of the award for excellent teaching in a large class (more than 30 students) given by the Associated Students of Stanford University. At Minnesota, he was named a Distinguished Lecturer by the Department of Economics and voted Teacher of the Year by the master's degree students at the Hubert H. Humphrey Institute of Public Affairs. Taylor has been a guest speaker for groups of teachers of high school economics, visiting diplomats from eastern Europe, talk-radio shows, and community groups. From 1989 to 1997, Professor Taylor wrote an economics opinion column for the San Jose Mercury-News. He has published multiple lectures on economics through The Teaching Company. With Rudolph Penner and Isabel Sawhill, he is co-author of Updating America's Social Contract (2000), whose first chapter provided an early radical centrist perspective, "An Agenda for the Radical Middle". Taylor is also the author of The Instant Economist: Everything You Need to Know About How the Economy Works, published by the Penguin Group in 2012. The fourth edition of Taylor's Principles of Economics textbook was published by Textbook Media in 2017.
BBN Times connects decision makers to you. Experts in their fields, worth listening to, are the ones who write our articles. We believe these are the real commentators of the future. We quickly and accurately deliver serious information around the world. BBN Times provides its readers human expertise to find trusted answers by providing a platform and a voice to anyone willing to know more about the latest trends. Stay tuned, the revolution has begun.
Leave your comments
Post comment as a guest