Comments
- No comments found

Big data statistical analysis is a powerful tool organizations use to make sense of data and guide their decision making.
As tools and techniques around big data proliferate, let’s not miss out on methods that have been around for quite some now, but haven’t lost their touch of accuracy – the statistical analytical methods.
Data is piling up and people are wondering what can be done with it. In this age of Information, there is no scarcity of data; data is overpowering. The key lies in sifting through the overwhelming volume of data that’s available to businesses and organizations, thereby interpreting its implications correctly. Perhaps, a few statistical analysis methods can help find some nuggets of gold buried in all that noise.
There obviously are thousands of big data tools, all promising to save your time and money, and also uncover unprecedented business insights. While all of that may be true, navigating the maze of big data tools could be quite overwhelming and tricky. We suggest you start your data analysis efforts with a handful of basic, yet effective, statistical analysis methods for big data, before advancing to the more sophisticated techniques.
Listed here are five fundamental statistical analysis methods that you can start with, along with the pitfalls that you must watch out for.
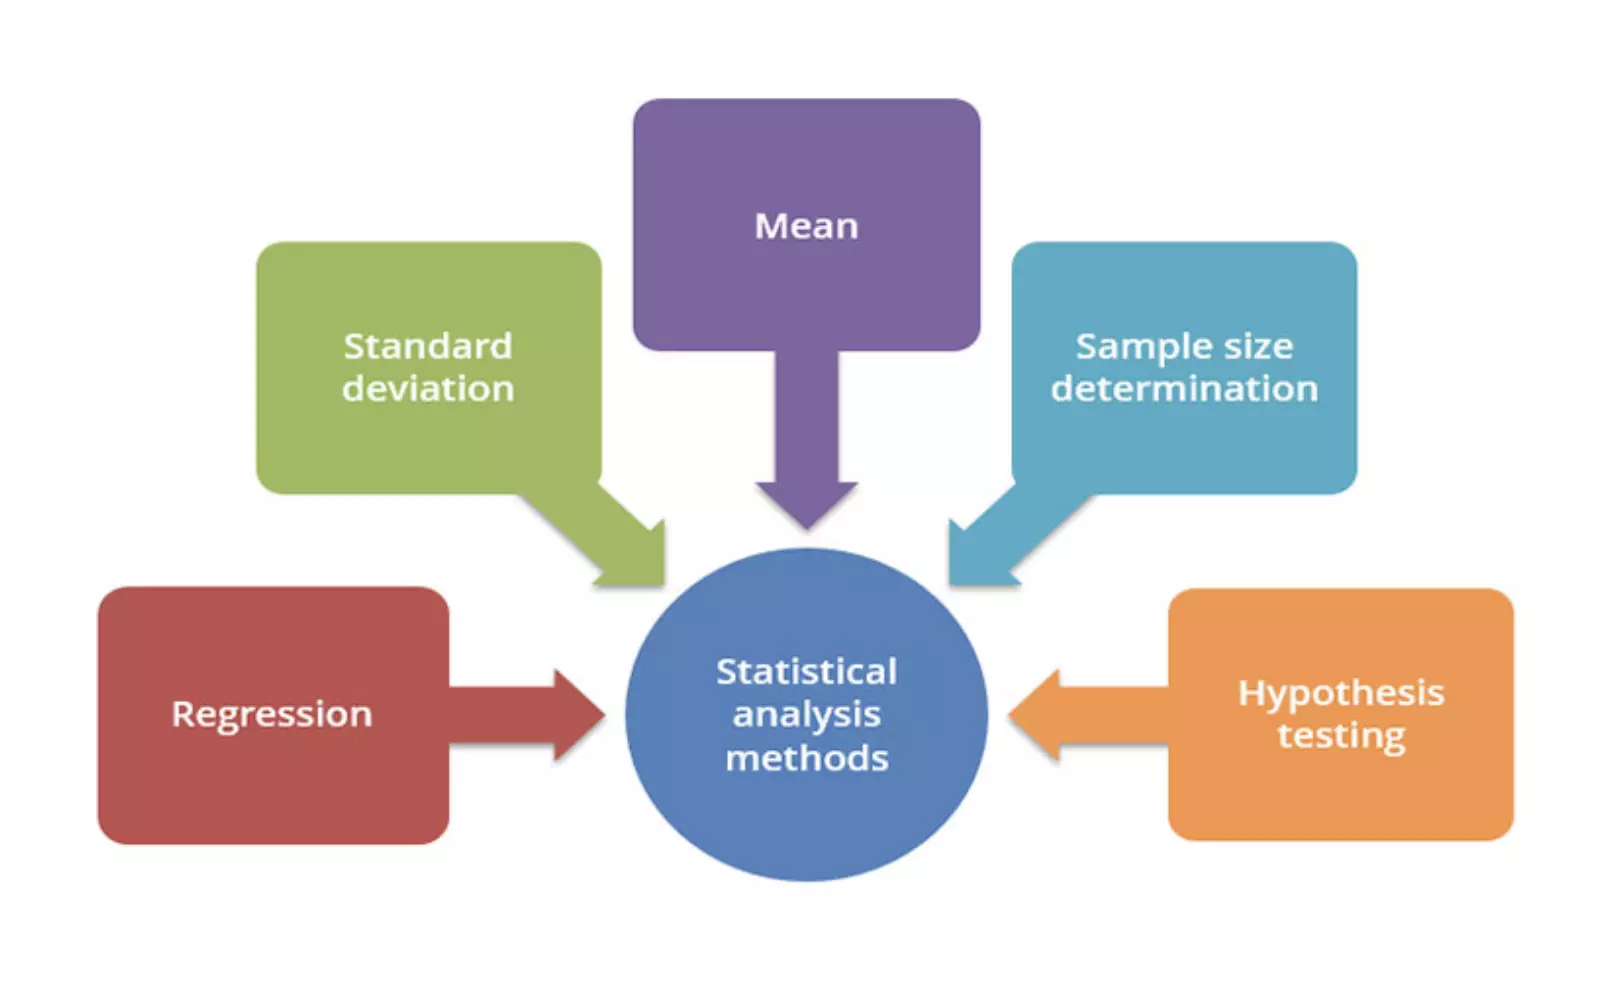
More commonly known as the average, the arithmetic mean is the sum of a list of numbers divided by the number of items on the list. Using the method of mean you can determine the overall trend of a data set or obtain a rapid snapshot of your data. This method offers the advantage of simplistic and quick calculation.
Pitfall
If used alone, the mean is a dangerous tool, and in some data sets, it is also closely related to the mode and median. Remember, in a data set with skewed distribution or a high number of outliers, mean simply does not provide the kind of accuracy that’s needed for a nuanced decision.
This is a measure of the spread of data around the mean. While a high standard deviation means the data spreads widely from the mean, a low deviation signals that most data aligns with the mean. This statistical analysis method is useful for quickly determining the dispersion of data points.
Pitfall
Similar to mean, the standard deviation too, is deceptive if taken alone. For example, if the data has many outliers or a strange pattern such as a non-normal curve, standard deviation won’t give you all the information needed.
The relationship between dependent and explanatory variables is modeled using the method of regression. The regression line helps determine whether those relationships are strong or weak, as well as the trends over time.
Pitfall
Regression is not very nuanced and the outliers on a scatter plot (as well as the reasons for them) matter significantly. For example, an outlying data point may represent your highest selling product. The nature of the regression line is such that it tempts you to ignore these outliers.
A sample does the job just as well when the data set is large and you don’t want to collect information from each element of the dataset. The trick lies in determining the right size for the sample to be accurate.
Pitfall
When analyzing a new, untested variable in a data set, you need to rely on certain assumptions, which might be completely inaccurate. If such an error passes onto your sample size determination, it can affect the rest of your statistical data analysis.
This method is about testing if a certain premise is actually true for your data set. The results of this test are statistically significant if the results couldn’t have happened by a random chance.
Pitfall
To be rigorous, watch out for the placebo effect, as well as the Hawthorne effect.
These statistical analysis methods add a lot of insight to your decision-making portfolio. Missing out on these methods for a lot of other fancy tools and techniques will be non-judicious on your part.
Naveen is the Founder and CEO of Allerin, a software solutions provider that delivers innovative and agile solutions that enable to automate, inspire and impress. He is a seasoned professional with more than 20 years of experience, with extensive experience in customizing open source products for cost optimizations of large scale IT deployment. He is currently working on Internet of Things solutions with Big Data Analytics. Naveen completed his programming qualifications in various Indian institutes.
BBN Times connects decision makers to you. Experts in their fields, worth listening to, are the ones who write our articles. We believe these are the real commentators of the future. We quickly and accurately deliver serious information around the world. BBN Times provides its readers human expertise to find trusted answers by providing a platform and a voice to anyone willing to know more about the latest trends. Stay tuned, the revolution has begun.
Leave your comments
Post comment as a guest