Comments
- No comments found

Organisations are revamping their data science and engineering strategies to gain the necessary skills to deploy artificial intelligence (AI) and machine learning (ML) systems.
Companies are now hiring legions of data scientists and other data experts to build artificial intelligence, machine learning and deep learning (DL) applications, trained analytics translators to connect the business and technical realms, and upskilled frontline staff to use advanced technological applications effectively.
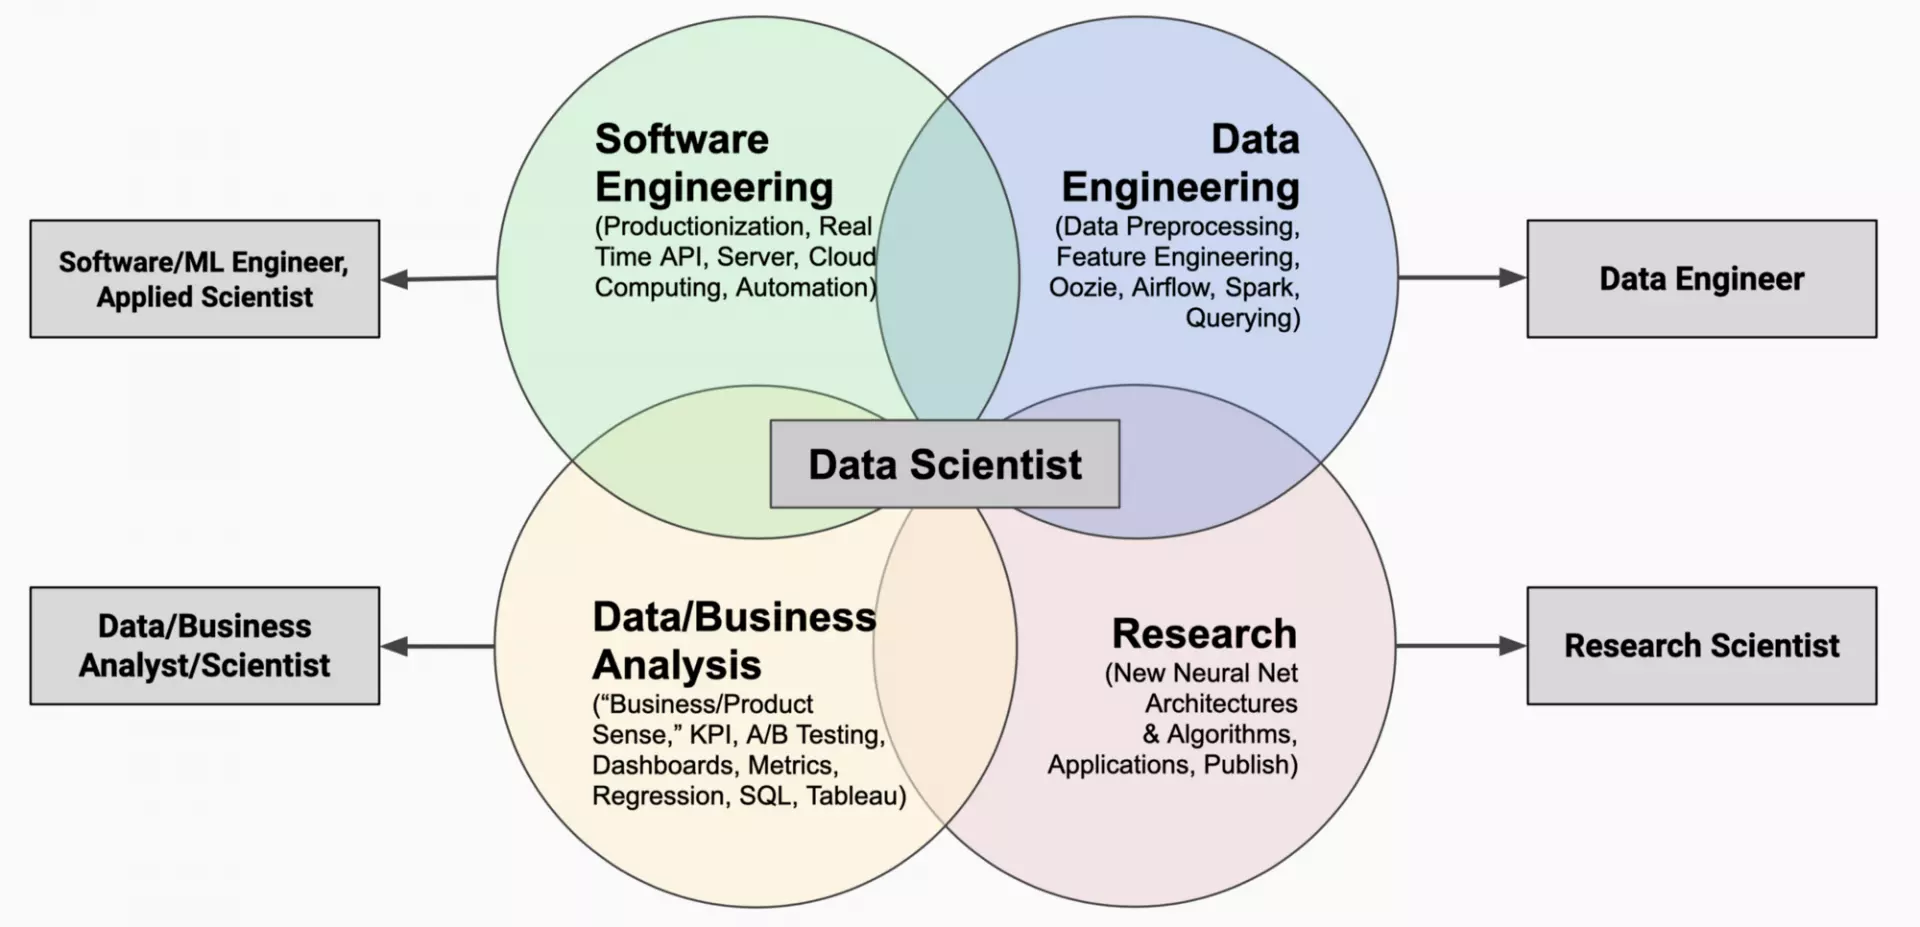
One role in particular, the data scientist, has been especially difficult for leaders to fill as competition for its illusive knowledge increased.

Data science and engineering is a transdisciplinary field that uses scientific methods, processes, algorithms and systems to extract causal knowledge from structured and unstructured data, and apply causal insights from data across a broad range of application domains.
The combination of data science and engineering can help design and build data/information processing systems in information technology, digital electronic computers, artificial intelligence, machine learning, deep learning and even data analytics systems.
Data science and engineering aims to unify computer science and information science, mathematics and statistics, data analysis and empirical science, all within data typology (ontology) frameworks, to understand and analyse real world data.

A data set is a collection of one or more tables, schemas, points, and/or objects that are grouped together either because they’re stored in the same location or because they’re related to the same subject.
Several classic data sets have been used extensively in the statistical literature: Iris flower data set – Multivariate data set introduced by Ronald Fisher (1936). MNIST database – Images of handwritten digits commonly used to test classification, clustering, and image processing algorithms Categorical data analysis – Data sets used in the book, An Introduction to Categorical Data Analysis. Robust statistics – Data sets used in Robust Regression and Outlier Detection (Rousseeuw and Leroy, 1986). Provided on-line at the University of Cologne. Time series – Data used in Chatfield's book, The Analysis of Time Series, are provided on-line by StatLib. Extreme values – Data used in the book, An Introduction to the Statistical Modeling of Extreme Values are a snapshot of the data as it was provided on-line by Stuart Coles, the book's author. Bayesian Data Analysis – Data used in the book are provided on-line by Andrew Gelman, one of the book's authors. The Bupa liver data – Used in several papers in the machine learning (data mining) literature. Anscombe's quartet – Small data set illustrating the importance of graphing the data to avoid statistical fallacies
A time series is a series of data points indexed (or listed or graphed or plotted via run charts (a temporal line chart)) in time order; a sequence taken at successive equally spaced points in time; a sequence of discrete-time data, eg, letters and words, seasonal precipitation, heights of ocean tides, counts of sunspots, the Dow Jones Industrial Average, etc.
Time series are used in any domain of applied science and engineering which involves temporal measurements, statistics, signal processing, pattern recognition, econometrics, mathematical finance, weather forecasting, earthquake prediction, electroencephalography, control engineering, astronomy, communications engineering.
In the context of pattern recognition and machine learning, time series analysis can be used for clustering, classification, query by content, anomaly detection as well as forecasting.
A time series has a natural temporal ordering applied to real-valued, continuous data, discrete numeric data, or discrete symbolic data (sequences of characters, such as letters and words) with the primary goal of time series analysis to forecast.
The Granger statistical causality test, which is not any causality, is widely applied in econometrics to determine whether one time series is useful in forecasting another. Rather than testing whether Y causes X, the Granger causality tests whether Y forecasts X.
When time series X Granger-causes time series Y, the patterns in X are approximately repeated in Y after some time lag. Thus, past values of X can be used for the prediction of future values of Y.
In all, the time series data is a type of panel data, the general class, a multidimensional data set.
A number of tools for investigating time-series data are hard to count:
Principal component analysis (or empirical orthogonal function analysis)
Singular spectrum analysis
General State Space Models
Dynamic time warping
Cross-correlation
Dynamic Bayesian network
Time-frequency analysis techniques
Machine Learning
Artificial neural networks
Support vector machine
Fuzzy logic
Gaussian process
Hidden Markov model
As a combination of time series analysis and cross-sectional analysis, the panel data looks as more meaningful or informative, being widely used in the social sciences with a view:
to understand causation of events that may have occurred in the past and how they lead to outcomes observed in later waves of the data, as the effect of the passage a new law on crime statistics, or a natural disaster on births and deaths years later, or how stock prices react to merger and earnings announcements;
to track trends and changes over time by asking the same respondents questions in several waves carried out of time, as to measure poverty and income inequality by tracking individual households;
to track company profitability, risk, and to understand the effect of economic shocks or determine the factors that most affect unemployment;
to perform regression analysis, as to determine how many specific factors such as the price of a commodity, interest rates, particular industries, or sectors influence the price movement of an asset;
to event study to analyse the impact of an event, as Covid-19, on an industry, sector or the overall market, etc.
The time series data is studied by data science and engineering , which is all about creating value from data; to better understand data relationships, uncover insights, predict future trends and behaviour and make intelligent decisioning.
Organisations are finding it difficult to compete with start-ups and tech giants such as Google, Meta and Twitter to attract or retain the best practising data scientists and the newest crop of graduates.
Due to the Covid-19 pandemic, tech start-ups may struggle to survive, making it somewhat easier for incumbents to acquire these hard-to-get skills.

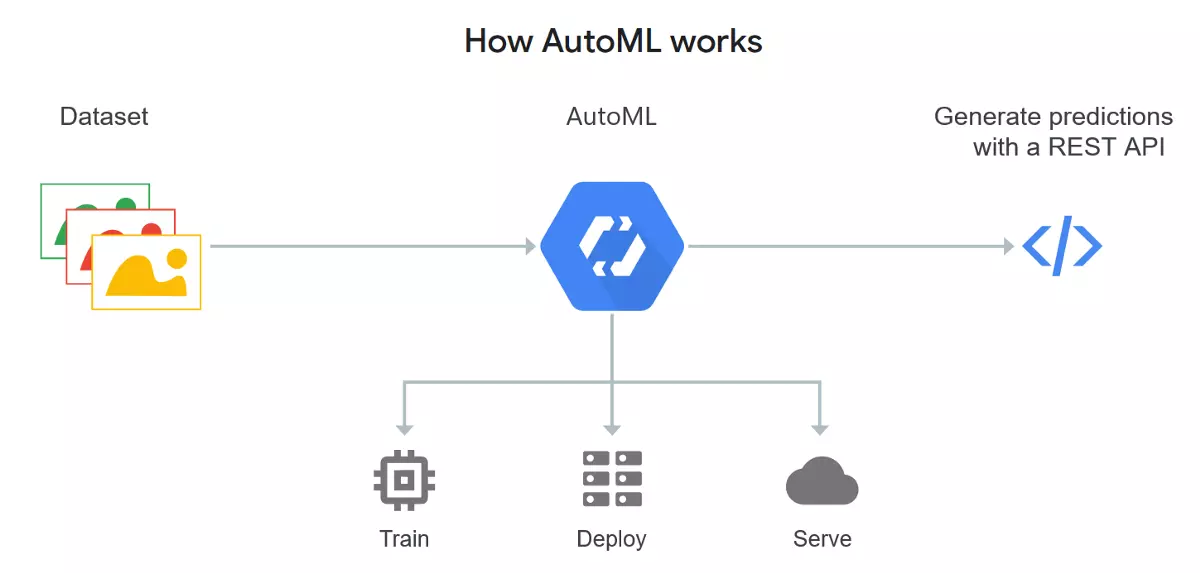
There are also new tools that have the potential to fill the data-science talent gap and increase the efficiency of analytics teams. Automated machine learning (ML) tools, commonly called AutoML, are designed to automate many steps in developing machine learning models.
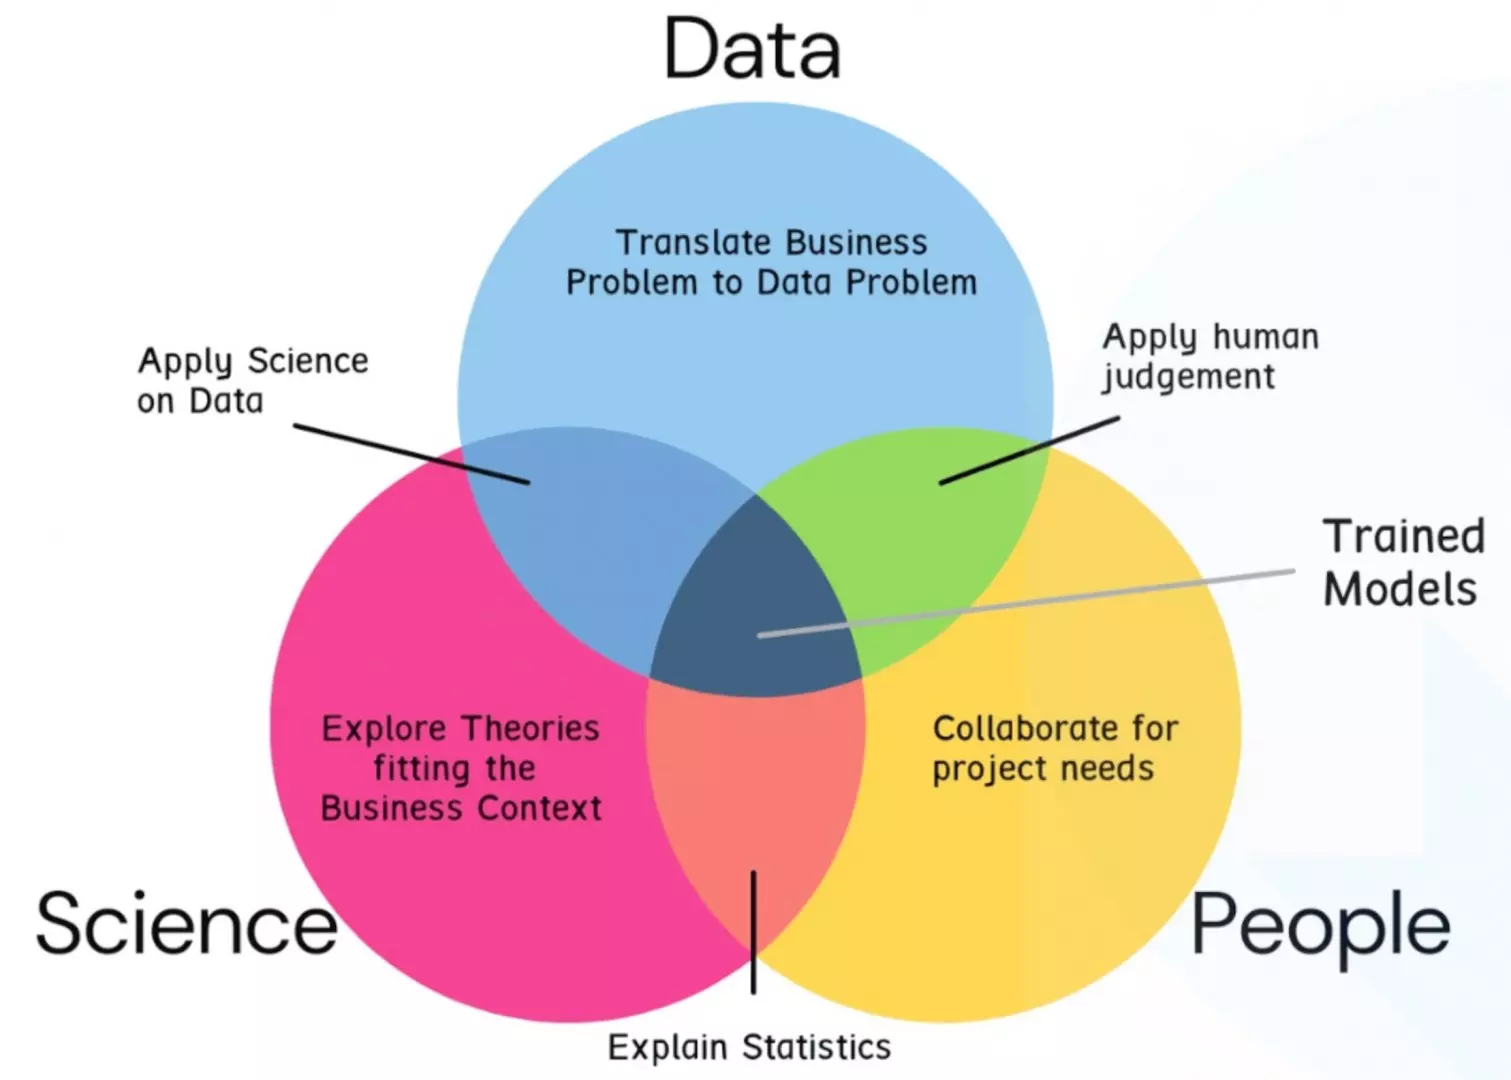
Data science and engineering require deep thinking & multi-discipline collaboration.
In order to stay competitive, organizations will be best served by not putting all their resources into the fight for sparse technical talent, but instead focusing at least part of their attention on building up their troop of AutoML practitioners, who will become a substantial proportion of the talent pool for the next decade.
Leave your comments
Post comment as a guest