Comments
- No comments found

Businesses can make use of heat maps as a powerful tool for interactive data visualization.
Heat mapping is used across many industries from retail to healthcare, to gain valuable insights into customer behavior, trends, performance metrics, or any other business analytics requirement.
But what actually goes into creating a heat map? What criteria can you use to make it effective? In this article, we’ll provide an overview of how heat maps work in business mapping and look at the types and key features available that can help improve decision-making.
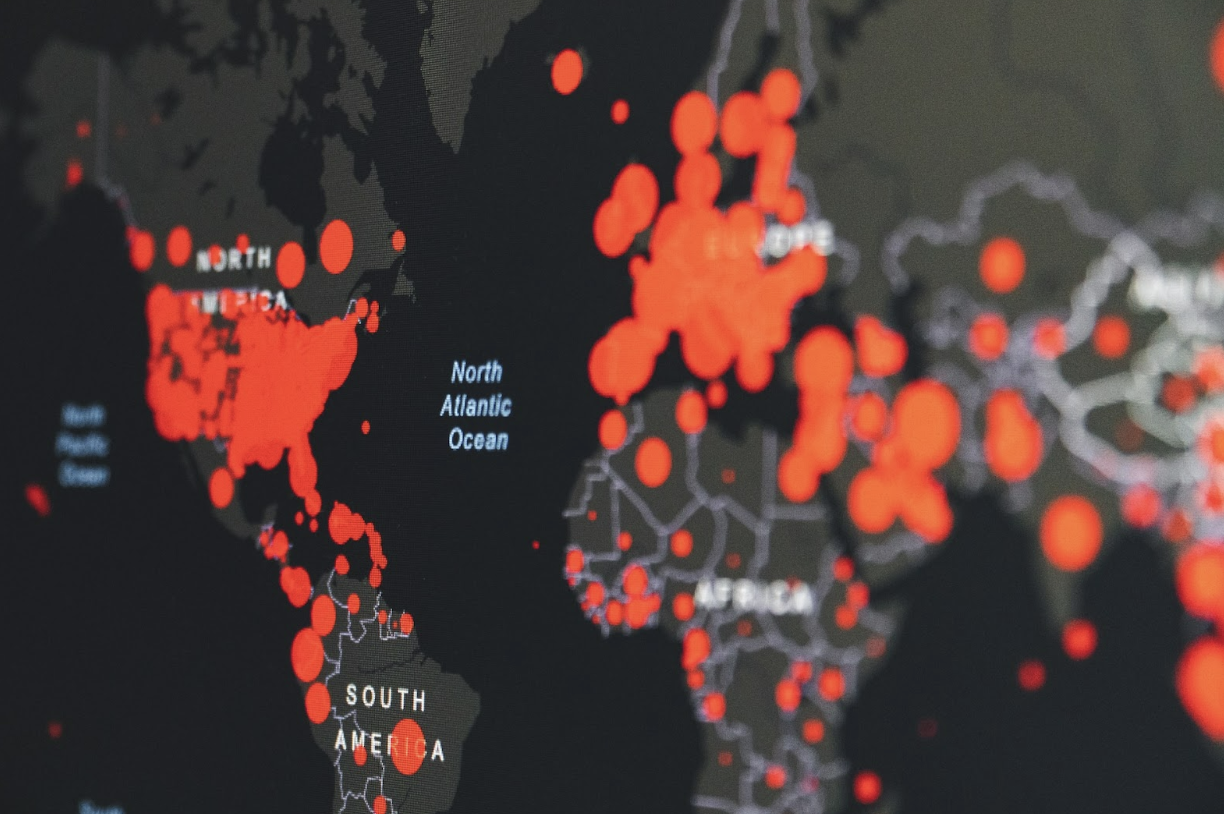
Heat maps have become increasingly popular tools for visualizing data in various industries. Essentially, heat maps use color coding to represent the intensity of certain data points, allowing for quick and intuitive analysis of complex data sets.
But the benefits of heat maps extend beyond simplistic representation; they enable users to identify patterns and trends in data, as well as outliers and anomalies. This is particularly useful for businesses seeking to optimize their operations or customer experience, as heat maps can reveal areas of high and low activity, helping to identify pain points or opportunities for improvement. According to statistics, B2B marketers who used heat maps gained 10% more leads than those who didn't.
Overall, heat maps are a powerful data visualization tool that can give businesses a competitive edge by improving their understanding of complex, multidimensional data.
Heat maps are an extremely useful tool for businesses in areas where data is geo-referenced. They allow companies to quickly visualize information about a particular place and make decisions accordingly. For example, companies can use heat maps to plot zip codes or map out customer demographics by using the location of their customers’ addresses. This type of mapping allows businesses to target their marketing efforts better and optimize operations in that area.
Companies use heat maps to monitor their competitors, which helps them gain a deeper insight into the competitive landscape of a particular area. This insight then enables them to make informed decisions on how they will interact with other companies operating in the same region.
Heat maps are an invaluable tool for businesses that need insights into the data of an area. By providing insights into customer behavior, target demographics, and competitors, businesses can make more informed decisions.
There are several different types of heat maps, each with its unique focus and advantages. For example, density heat maps use color coding to represent areas of higher or lower density within a set of data. On the other hand, choropleth heat maps utilize geographic boundaries such as state or country borders to represent specific data points.
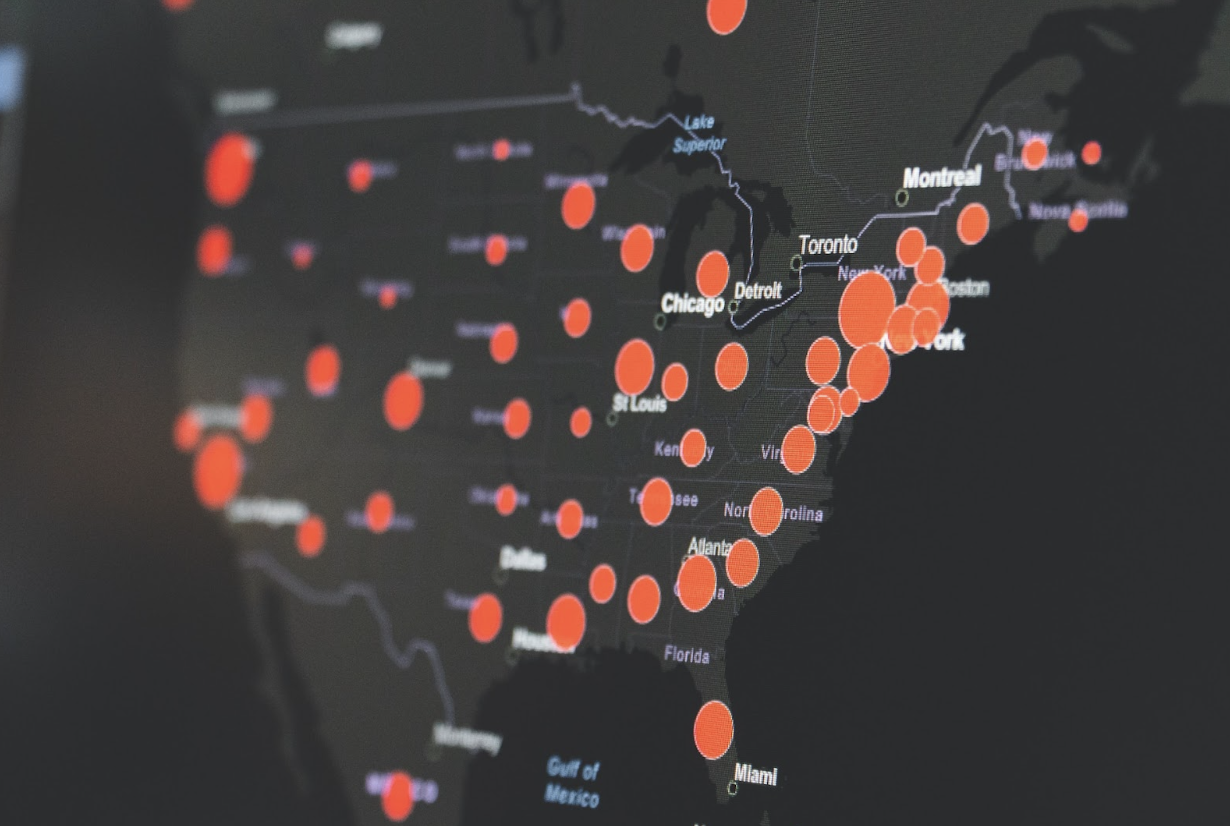
By analyzing data visually, heat maps allow businesses to quickly identify patterns and trends that may not be apparent when looking at raw data. These maps are particularly effective when it comes to identifying geographical trends, which can be crucial when seeking out new markets or customer bases.
With the ability to easily discern areas that are performing well, businesses can then focus their efforts on identifying what factors are contributing to that success and working to replicate it elsewhere. In addition, heat maps are highly versatile, which makes them appropriate for various applications such as analyzing website traffic and optimizing the supply chain.
The whole purpose of a heat map is to visually represent data using color variations, making it a crucial component of any data visualization tool. Choosing the wrong color scale can lead to misinterpretation of data and defeat the purpose of the heat map altogether. To choose the appropriate color scale for a heatmap, it is essential to consider factors like the audience, data type, and context.
The correct color scale will highlight the data's key features and make it easy to identify trends and insights. So, take your time and explore different color scales to create a heat map that conveys your data accurately and effectively.
Throughout this blog post, we explored the concept of heat maps and how they are used to scale and map data in business mapping. While heat maps can help any company understand its consumer trends and behavior, it’s essential to remember that every heat map should be tailored to each individual business's needs. Ultimately, businesses should commit to creating and customizing their own heat maps in order to have the greatest success possible when it comes to mapping their data.
BBN Times connects decision makers to you. Experts in their fields, worth listening to, are the ones who write our articles. We believe these are the real commentators of the future. We quickly and accurately deliver serious information around the world. BBN Times provides its readers human expertise to find trusted answers by providing a platform and a voice to anyone willing to know more about the latest trends. Stay tuned, the revolution has begun.
Leave your comments
Post comment as a guest