Stock markets have finally taken a breather over the last fortnight, although the S&P 500 has made a new, marginal, high this week. Cause for concern has been growing, however, in the bond markets where 2yr US bonds have seen a stately rise in yields. The chart below shows the constant maturity 2yr (blue) and 10yr (red) Treasury Note since January 2016:
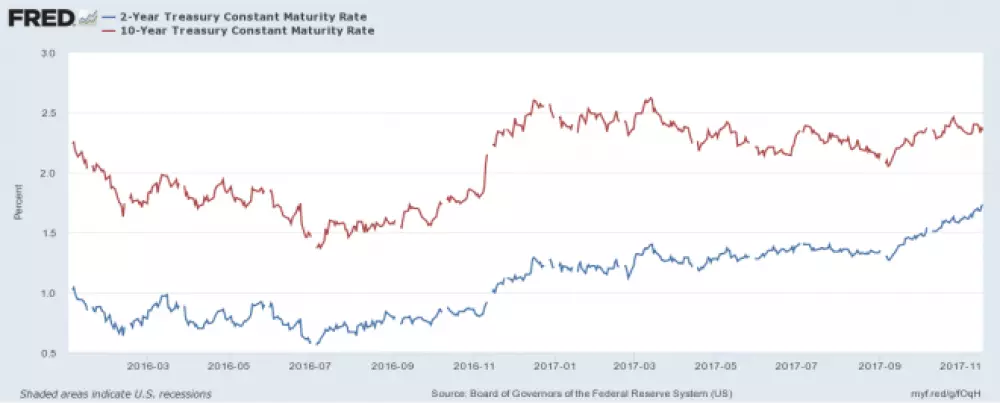
Source: Federal Reserve Bank of St Louis
The flattening of the yield curve has led many commentators to predict an imminent recession. Looking beyond the Treasury market, however, the picture looks rather different. The next chart shows the spread of Moody’s Aaa and Baa corporate bond yields over 10yr Treasuries:
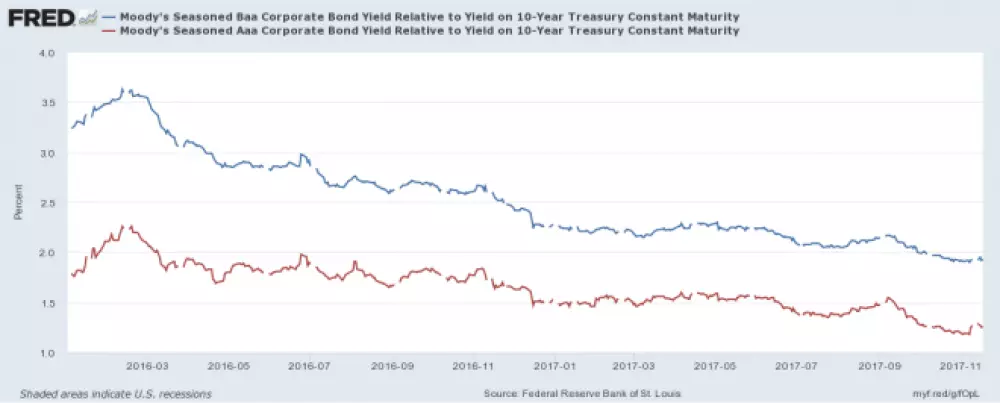
Source: Federal Reserve Bank of St Louis, Moody’s
Spreads have continued to tighten despite the rise in short-term rates. In absolute terms their yields have risen since the beginning of November but this is from record lows. The High Yield Index (purple) shows this more clearly in the chart below:
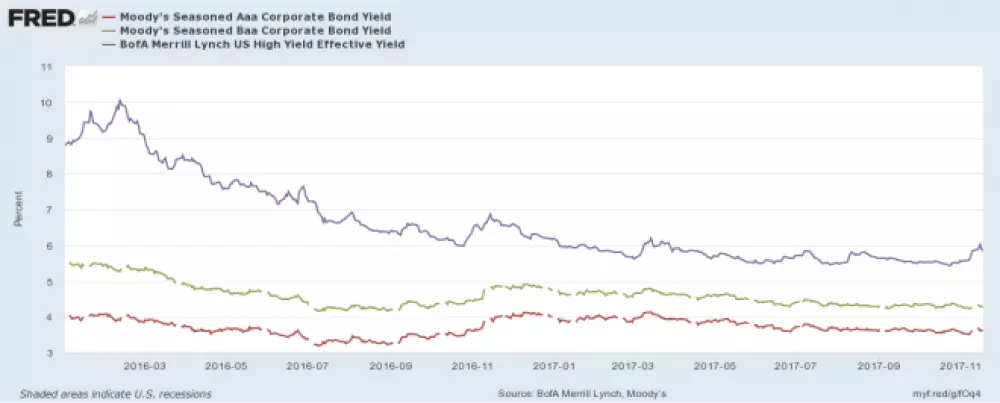
Source: Federal Reserve Bank of St Louis, Moody’s, Merrill Lynch
A similar spike in yields was evident in November 2016. I believe, in both cases, this may be due to position squaring ahead of the Thanksgiving holidays and the inevitable decline in liquidity typical of December trading. There are differences between 2016 and this year, however, the strength of the high-yield bond bull market was even more pronounced last year but Treasury 2yr Note yields had only bottomed in July, it was too soon to predict a bear market and the Federal Reserve were assuming a less hawkish stance.
This year the rising yield of 2yr Notes has been more clear-cut, which may encourage further liquidation over the next few weeks, however, with economic growth forecasts being revised higher, rating agencies have upgraded many corporate issuers. Credit quality appears to be improving even as official interest rates rise and the US Treasury yield curve flattens.
In Macro Letter – No 74 – 07-04-2017 – US 30yr Swaps have yielded less than Treasuries since 2008 – does it matter? I examined the evolution of the interest rate swap (IRS) market over the last few years. I’ve updated the table showing the spread between T-Bonds and IRS across maturities:
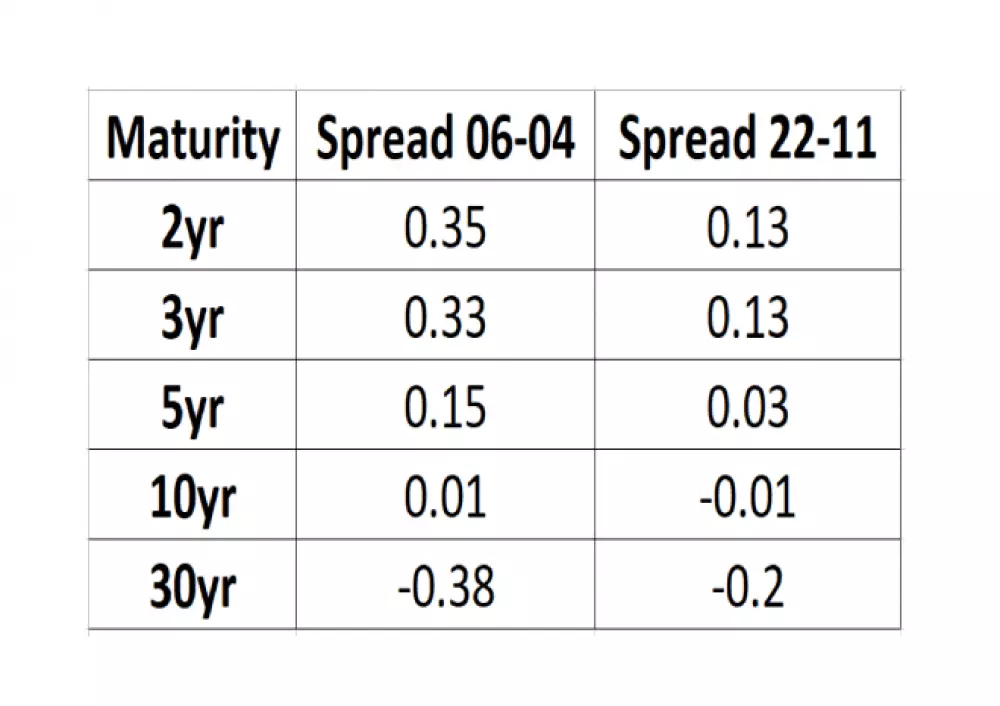
Source: Investing.com, The Financials.com
At the 10yr maturity the differential between IRS and Treasuries has barely changed, but elsewhere along the yield curve, compression has occurred, with maturities of less than 10 years narrowing whilst the 30yr IRS negative spread has also compressed, from nearly 40 basis points below Treasuries to just 20 basis points today. In other words, the flattening of the IRS yield curve has been much less dramatic than that of the Treasury yield curve – 2yr/30yr IRS has flattening by 36 basis points since early April, whilst 2yr/30yr Treasuries has flattened by 76 basis points over the same period.
It is important to note that while the IRS curve has been flattening less rapidly it still remains flatter than the Treasury curve (IRS 2’s/30’s = 0.67% Treasury 2’s/30’s = 1.00%). One interpretation is that the IRS curve has been reflecting the weakness of economic growth for a protracted period while the Treasury curve has been artificially steepened by the zero interest rate policy of the Federal Reserve.
Conclusions and Investment Opportunities

Many commentators have pointed to the flattening of the Treasury yield curve as evidence of an imminent recession, the IRS curve, however, has flattened by far less, partly because it was flatter to begin with. Perhaps the IRS curve reflects the lower trend growth of the US economy since the great recession. An alternative explanation is that it is a response to investment flows and changes in the regulatory regime (as discussed in Macro letter – No74).
One thing appears clear, the combination of unconventional central bank policies, such as quantitative easing (QE) and the relentless, investor ‘quest for yield’ over the last decade has distorted the normal signalling power of the bond market.
Economic growth forecasts continue to be revised upwards, prompting central banks to begin reducing the quantum of QE in aggregate. Corporate earnings have generally been rising, credit quality improving. We are nearer the end of the bull market than the beginning, but it is much too soon to predict the end, on the basis of the recent rise in corporate bond yields.


Leave your comments
Post comment as a guest